Expert witness Dr. John Lloyd has served attorneys nationwide for 25+ years in biomechanics, human factors, helmet testing and motorcycle accident expert
Football helmet expert, Dr. John Lloyd, had the privilege to present his research on football helmets as part of the Keynote address at the National Instrument conference in Austin, TX this week. The audience of 5,000+ attendees learned about Dr. Lloyd’s research into biomechanics of the brain.
It has been said that helmets cannot prevent concussions. I disagree.
As a biomechanist I have dedicated my career to studying the biomechanics of brain injuries. There are two key mechanical forces that give rise to head and brain injuries (1) linear forces, which are responsible for visible injuries, including bruising and skull fractures, and (2) rotational forces, which cause invisible injuries, such as concussion and brain injury.
Since helmets are currently designed to pass testing standards that focus on linear forces only, it is no surprise that helmets have limited benefit in preventing concussions. Through advances in medicine we have learned that concussions can potentially have life-long neurological consequences, including memory impairement and personality changes / behavioral effects.
Over the past years I have developed and validated a testing method to evaluate helmets in terms of their ability to protect against both linear and rotational forces. Using this apparatus I characterized football helmets, results of which have been submitted to Science for publication.
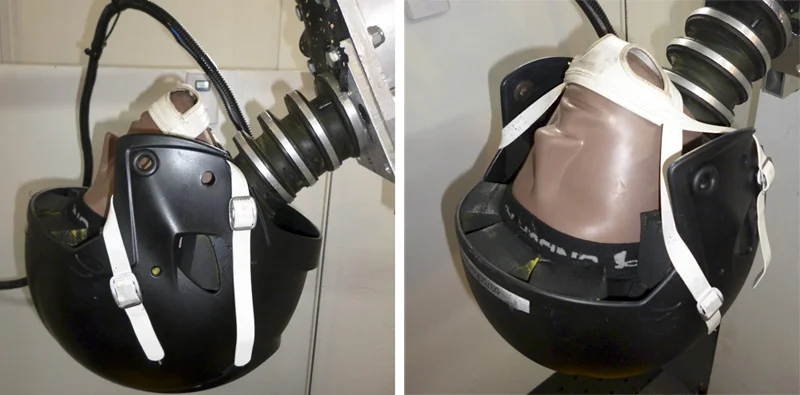
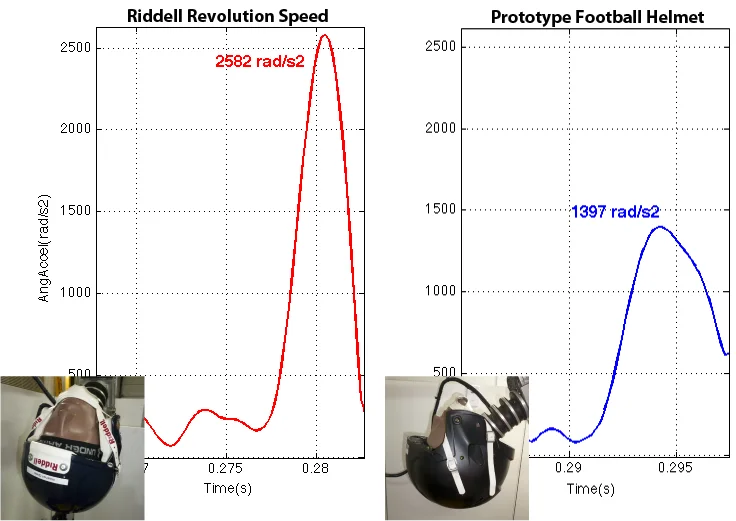
Based on lessons learned from my biomechanical evaluation of various sports helmets, I have devised a matrix of shear-thickening non-Newtonian materials. A prototype helmet was constructed using this matrix liner, results of which show that rotational forces that cause concussion and other brain injuries are reduced by up to 50% compared to a leading football helmet, while also reducing linear forces.
It is my goal and my passion to work with leading helmet companies to make this technology available to players and sports participants of all aged to enhance their protection against brain trauma. I am looking to collaborate with one manufacturer in each sport to offer an exclusive license patent-pending technology.
John Lloyd of BRAINS, Inc. announced today that football head injuries and concussions can be reduced up to 50 percent with their new helmet safety breakthrough.
San Antonio, FL – Dr.John Lloyd PhD of BRAINS, Inc. announced their latest breakthrough in football helmet safety today. The unique new helmet technology promises to provide up to 50 percent more protection against football head injuries and concussions. The technology has wide application and can be used in every kind of helmet from baby helmets to military helmets, and for all athletes at risk of concussion and head injuries such as football players, cyclists, skiers, snowboarders, skateboarders, hockey players, baseball players, lacrosse players, boxers, soccer players, equestrian / horse-riding sports, such as polo and horse racing, as well as motorcycle and race car drivers.
Recent medical research documents found that concussions and cumulative head impacts can lead to lifelong neurological consequences such as chronic traumatic encephalopathy, a degenerative brain disease known as CTE and early Alzheimer’s.
The U.S. Centers for Disease Control and Prevention, estimates 1.6 – 3.8 million sport-related brain injuries annually in the United States. Of these 300,000 are attributed to youth football players, some of whom die from their injuries every year – a tragedy difficult for their mothers and families to recover from.
The severity of the issue touching both the nation’s youth and professional athletes has led to thousands of lawsuits and Congressional Hearings. Growing concern has spread to the White House where President Obama recently spoke at the Healthy Kids and Safe Sports Concussion Summit.
The BRAINS, Inc. research team, led by renowned brain injury expert, Dr. John Lloyd, has worked for years on their project to help make sports safer. A controversial subject, some opponents have stated that concussion prevention is impossible. Dedicated to saving lives and preserving brain health, Dr. Lloyd and team persevered with their work leading to this new innovation. “Our results show that forces associated with concussion and brain injury are reduced up to 50% compared to similar testing with a leading football helmet,” said Dr. John Lloyd, Research Director.
“The patent-pending matrix of non-Newtonian materials will not only benefit football, but can be utilized in all sports helmets as well as military, motorcycle and even baby helmets to improve protection and dramatically reduce the risk of brain injuries,” reported Dr. Lloyd.
The materials are inexpensive, and produce a helmet that is considerably lighter and more comfortable than a traditional helmet. Two additional applications of this new safety technology include medical flooring especially in hospitals and nursing homes or child play areas , as well as vehicle interiors.
About BRAINS, Inc.
BRAINS, Inc. located in San Antonio, Florida, is a research and development company focused on the biomechanics of brain injuries. The company was founded in 2011 by John D. Lloyd Bio, Ph.D., CPE, CBIS, Board Certified Ergonomist and Certified Brain Injury Specialist. He has also provided expert witness services nationwide for over 20 years in the fields of biomechanics, ergonomics and human factors, specializing in the biomechanics of brain injury, including sport and motorcycle helmet cases, slips and falls, motor vehicle accidents and pediatric head trauma. BRAINS, Inc. is open to licensing with manufacturers to bring this much-needed technology to market for the protection of sports participants and athletes of all ages. For additional information visit : http://drbiomechanics.com/sports-helmet-football-helmets/new-helmet-technology/ or call 813-624-8986.
Motorcycle helmets were originally developed in the early 20th century and, like most helmets, are modeled after military helmets, the purpose of which is to protect against penetrating head injury. The modern motorcycle helmet, with a hard outer shell and rigid expanded polystyrene (EPS) liner was actually introduced over 60 years ago. The outer shell serves as a second skull, dispersing the impact force over a wider surface area, while the inner shell compresses in an attempt to reduce translational forces. A mechanism to mitigate tangential forces is absent. Since the liner fills the entire inner surface of the shell, tangential forces cannot be absorbed and are transmitted directly to the head and brain. Motorcycle helmet standards focus on reducing the effect of linear impact forces by dropping them from a given height onto an anvil and measuring the resultant peak linear acceleration.
Motorcycle Helmet Standards
In motorcycle helmet testing, the risk of impact loading injuries, such as skull fractures, can be determined by measuring linear accelerations experienced by a surrogate head form in response to impact. Whereas risk of impulse or inertial loading injuries, such as concussion, axonal injury and subdural hematoma can be quantified by measuring impact-related angular accelerations at the center of mass of a test head form.
Unfortunately, the evolution of motorcycle helmet design is not driven by advances in scientific knowledge, but rather by the need to meet applicable testing standards. In the United States, standards include the federal motor vehicle safety standard (FMVSS) #218, commonly known as the DOT motorcycle helmet testing standards, and Snell M2015, while ECE 22.05 and BSI 6658 were adopted in European countries. Test procedures involve dropping a helmeted head form onto various steel anvils at impact velocities ranging from only 5.0 to 7.75 m/s (11-17 mph). Pass/fail is based on the ability of the helmet to provide protection against forces associated with linear acceleration in response to impact.
Current motorcycle helmet testing standards do not incorporate measures of angular acceleration and therefore fail to assess whether helmets offer protection against catastrophic brain injuries. The omission of this critical measure is reflected epidemiologically in the disproportion of closed head injuries in fatal motorcycle accidents.
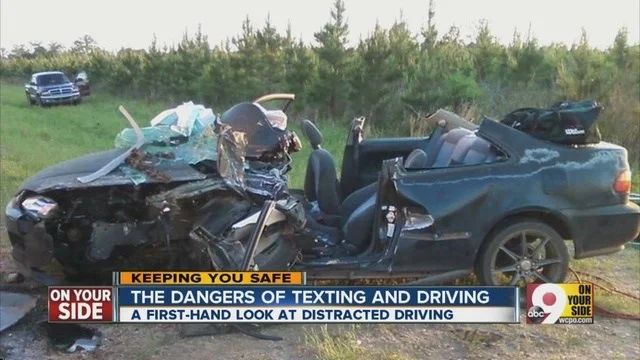
Distracted driving is any activity that diverts attention from driving, including talking or texting on your phone, smoking, eating and drinking. I have even seen people putting on makeup and shaving their face while driving!
Texting is the most alarming driver distraction. Sending or reading a text takes your eyes off the road for 5 seconds or more. At 40 miles per hour a car can travel the length of a football field in 5 seconds; at highway speeds, a vehicle can travel the length of almost two football fields in the same time.
Texting while driving and other cell-phone reading and writing activities are high-risk activities associated with motor vehicle collisions and mortality. In 2015 alone 3,450 people were killed on US roads. 391,000 were injured in motor vehicle crashes involving distracted drivers.
There are three types of driver distractions – manual, visual and cognitive.
Manual distractions cause you to take your hands off the steering wheel
Visual distractions cause you to take your eyes off the road
Cognitive distractions interfere with your mental focus on driving
Texting involves all three of the above distractions and is therefore considered a high risk activity while driving.
Many distractions exist while driving. Use of cellular phones while driving is a top distraction. Most new vehicles are equipped with hands-free technology, leading drivers to believe that talking via bluetooth is safe. However, this is not the case. In fact, human factors research shows that our brains remain distracted from the task of driving for several minutes even after hanging up a call. According to the National Safety Council, the use of cell phones while driving causes approximately 26% of motor vehicle crashes.
Human factors research shows that cell phone usage while driving is associated with increased reaction time, decreased situational awareness, more impulsive responses, and shrinks a drivers search area. Further, drivers exhibit less attention to objects even when looking directly at them. Moreover, “Impairments associated with using a cell phone while driving can be as profound as those associated with driving while drunk”. Hands free (Bluetooth) cell phone use is no less distracting than hand-held. What makes cell phone usage particularly dangerous is that drivers do not appreciate that their abilities are impaired due to distraction. Drivers distracted due to the use of cellular phones have little or no input to allow them to appreciate the things they did not see, or the things they looked at and did not process adequately.
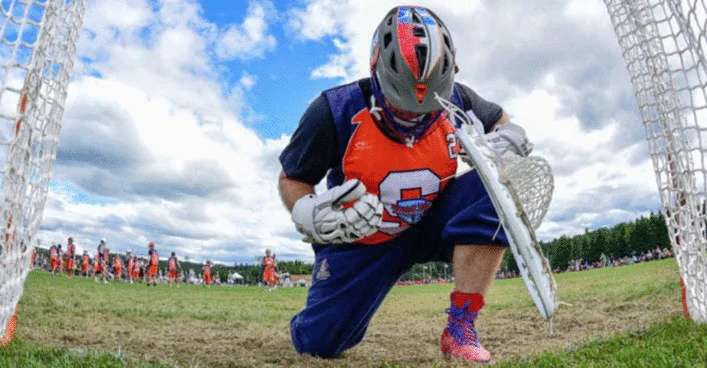
A male high-school athlete was participating in a team sport when a player from the opposing team attempted a goal. The male athlete was the only obstacle between the opposing player and a winning goal. The high speed shot, taken from less than 10 feet away, impacted the male athlete directly in the groin. He immediately fell to his knees in pain. Thankfully, he was wearing an new athletic protector (known colloquially as a “jockstrap”), which should have prevented injury even at such close quarters. Dr. John Lloyd was retained to perform a biomechanical analysis athletic protector.
The athlete sat out the remainder of the game. Later that evening he became concerned as the swelling continued. The following day tests revealed that amputation of one of his testicles was medically necessary. As a young man, with his whole life ahead of him, the physical and emotional pain of losing a testicle was almost unbearable.
The young man had conducted his research before purchasing the new athletic protector. The packaging had promised comfort and protection. Why then did he sustain this life-changing injury?
Athletic protector biomechanics expert Dr. John Lloyd, was retained to evaluate a potential product liability case.
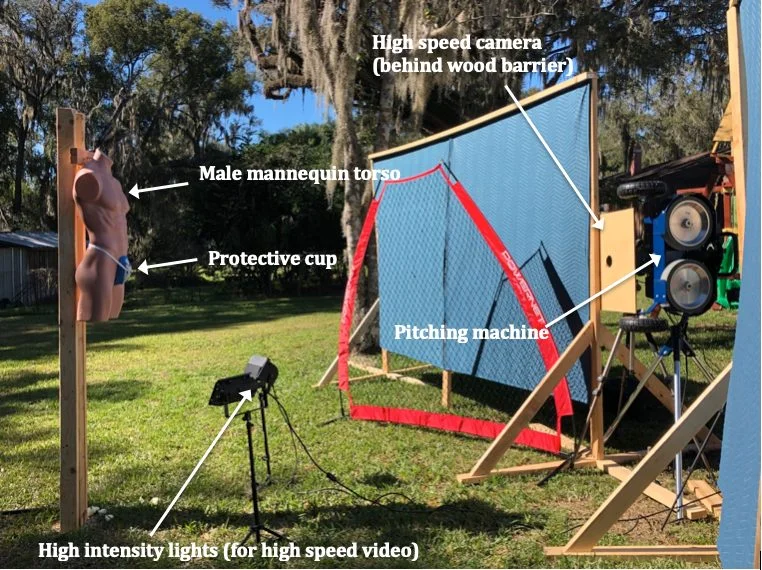
It was quickly discovered, interestingly, that there are no American Standards on the performance requirements of athletic protectors. Therefore, Dr. Lloyd devised a test method to evaluate exemplars of the subject jockstrap with comparison to models sold by other product manufacturers.
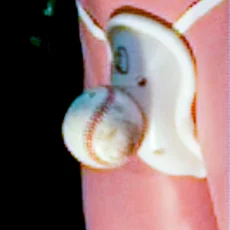
Balls were shot at various speeds from a pitching machine aimed at the athletic protectors affixed to a male mannequin. Each impact was recorded using a high-speed video camera, while Dr. Lloyd’s associate, standing behind the mannequin, measured the speed of each impact using a radar gun. A total of 70 tests were performed.
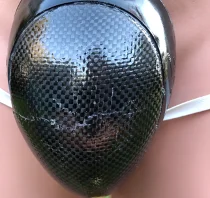
As the following high-speed video recording shows, the subject athletic protector deforms completely upon impact, providing the wearer with little, if any, protection from injury.
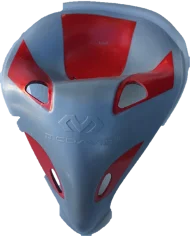
Several new design models also collapsed upon impact, while others cracked and broke
Fortunately, the old style jock strap with which many of us are familiar was among the few models that held up to impact and actually provided adequate protection.
Based on biomechanical analysis I concluded, to a reasonable degree of scientific certainty, that the subject athletic protector provides inadequate protection of the male genitalia from injury associated with impact from a moderate speed ball. This conclusion is based on evidence of extreme deformation of the jock strap upon direct impact from a ball.
Had the manufacturer evaluated their product under real-life conditions, as described herein, they would have learned that this product provides inadequate protection against injury to the male genitalia. Further, comparative testing of other available athletic protectors identified products that provide better protection.
The following is a case study in which biomechanics expert, Dr. John Lloyd, evaluated the risk of concussion and brain injury associated with headrest impact in rear end crashes.
Headrest Impact Test Apparatus:
In accordance with prior published test methods[1],[2],[3], a test apparatus was constructed to evaluate the biomechanical protection afforded by an exemplar automobile headrest against head and brain injuries during occipital head impacts in a simulated rear-end motor vehicle collision.
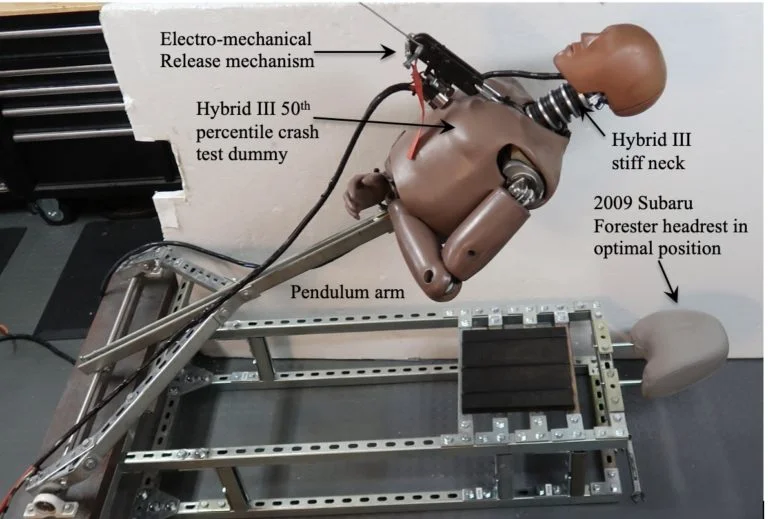
The apparatus involves a pendulum arm, attached by bearing housings to a weighted base. The upper body, including neck and head of a 50th percentile Hybrid III crash test dummy was mounted to the pendulum arm. Data acquisition was initiated by triggering an electromechanical release mechanism, allowing the mannequin to fall, under acceleration due to gravity, until the crash test dummy impacted the headrest and backrest (Figure 1).
Figure 1: Test apparatus
The fundamental elements and principles of this testing have been utilized in other laboratories. By utilizing a Hybrid III neck, the head impact tests are more realistic, causing head rotation at the axis between the head and neck, which produces measures of head and brain angular kinematics. The methods presented herein are based upon standardized test methodologies and published research.
Instrumentation
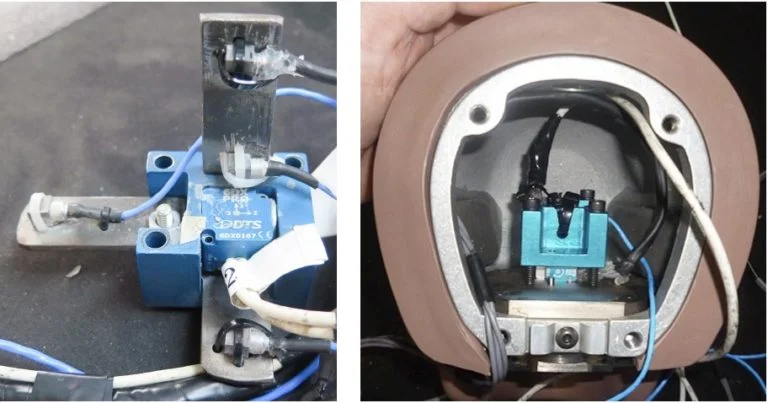
Four PCB Piezotronics tri-axial accelerometers (model # 356A01) were mounted in an X,Y,Z array at the center of mass of the Hybrid III headform, along with a tri-axial angular rate sensor produced by Diversified Technical Systems (composite Figure 2).
Figure 2: Sensor installation in Hybrid III headform
Sensor Calibration:
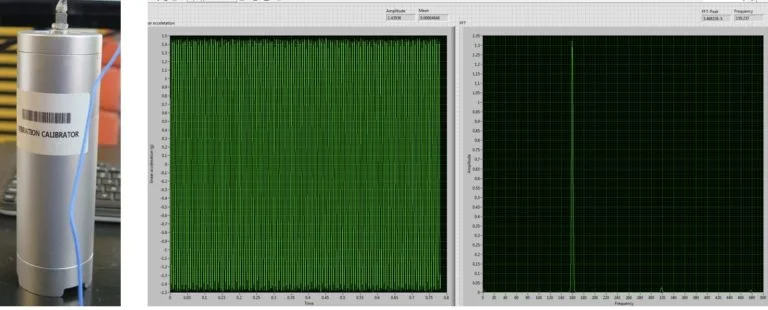
All sensors were calibrated by the manufacturer. Verification of calibration of the linear accelerometers was performed prior to testing using a calibration shaker. Results indicate that the sensors were operating in the specified frequency range and output (Figure 3).
Figure 3: Pre-test verification of linear accelerometer sensors
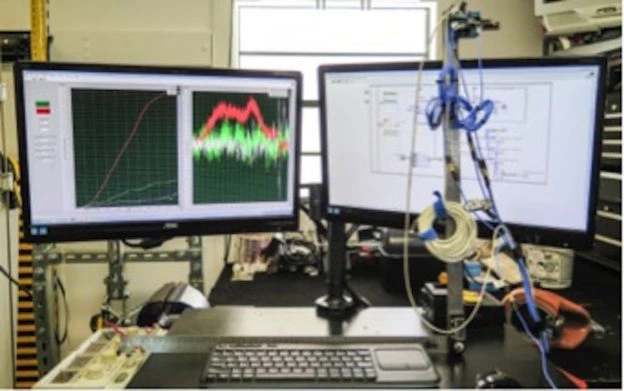
For the angular rate sensor, a simple validation method was devised in which the sensor was affixed to a digital goniometer that was rotated through a 90-degree angle. Using LabVIEW software, the integral of angular rate was computed, reflecting concurrence with the digital goniometer for all three planes of motion (Figure 4).
Figure 4: Pre-test validation of angular rate sensor calibration
Headrest Impact Testing:
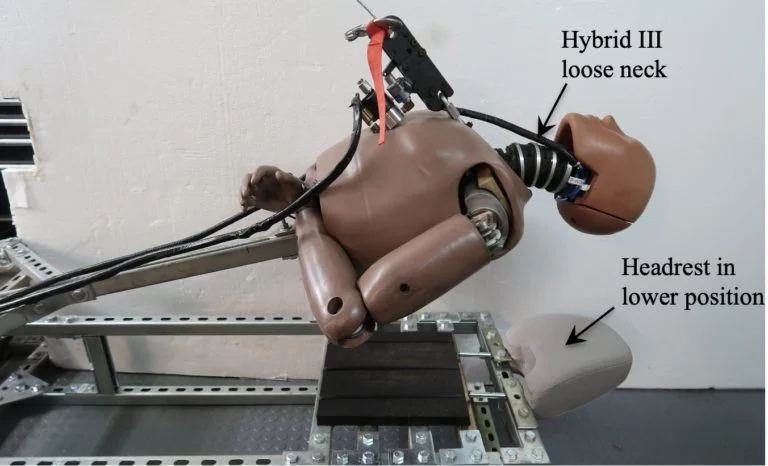
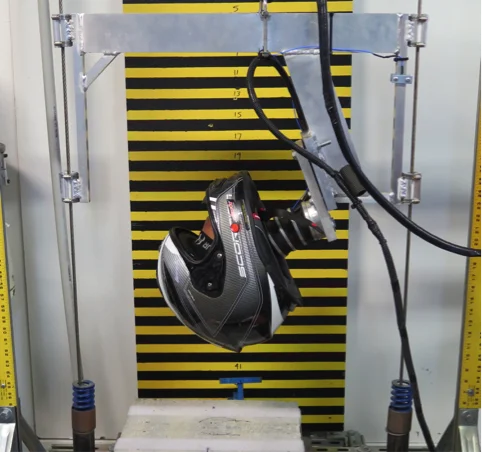
The mannequin head was raised from the headrest in 2-inch increments from 2 inches to 30 inches, generating head impact speeds from 1 to 25 miles per hour. Two headrest positions were evaluated, along with two different Hybrid III necks representative of a stiff and relaxed neck (Figure 5), for a total of sixty tests.
Figure 5: Test apparatus with Hybrid III loose neck and headrest in lower position
Data Acquisition and Analysis:
Data from the analog sensors were acquired in accordance with SAE J211 [4], using a National Instruments compact DAQ data acquisition system and LabVIEW software (National Instruments, Austin, TX). The raw data was then filtered in MATLAB (The MathWorks, Natick, MA) using a phaseless eighth-order Butterworth filter with cutoff frequencies of 1650 Hz and 300Hz for the linear accelerometers and angular rate sensors, respectively.
Angular acceleration values for sagittal, coronal and axial planes were computed from the angular velocity data using the 5-point central difference by least squares method (Equation 1):
Equation 1: Five-point central difference by least squares method
Angular acceleration vales were also derived from the array of linear accelerometers, by the mathematical method documented by Padgaonkar et al [5].
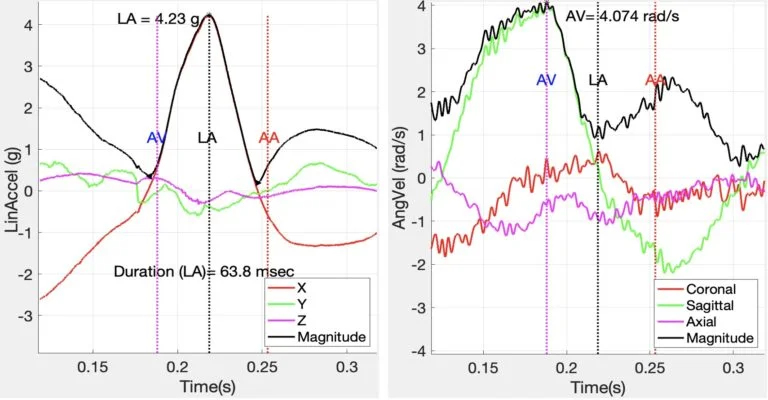
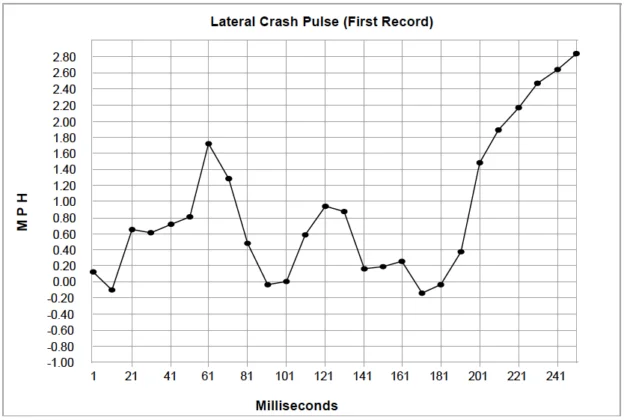
Linear velocity was calculated by integrating linear acceleration. Mathematical methods were performed using Matlab to compute characteristic values from variables of interest. Figure 6, below illustrates peak linear acceleration and angular velocity associated with a 6.8 mph occipital head impact against a headrest.
Figure 6: Linear acceleration and angular velocity associated with headrest impact
It is noted that the major component of linear acceleration was in the X-axis (anterior-posterior), while the major component of angular velocity was in the sagittal plane, as expected.
Linear acceleration values were used to calculate Maximum Pressure (Equation 2), Gadd Severity Index (GSI) (Equation 3), and Head Injury Criterion (HIC15) (Equation 4).
Equation 2: Maximum Pressure
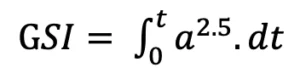
Equation 3: Gadd Severity Index
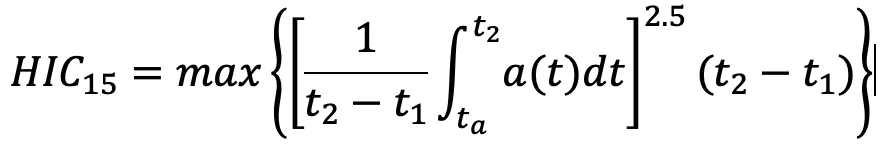
The Head Injury Criterion (HIC) is an empirical measure of impact severity describing the relationship between the linear acceleration magnitude, duration of impact and the risk of head trauma (Equation 4).
Equation 4: Head Injury Criterion
where a is resultant head acceleration, t2-t1 < 15 msec
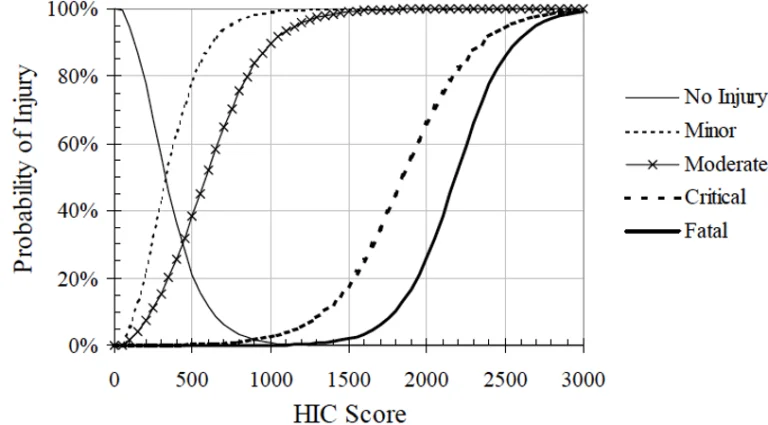
With reference to the Figure 7, below, the HIC value is used to predict the risk of head trauma: Minor –skull trauma without loss of consciousness; nose fracture; superficial injuries Moderate – skull trauma with or without dislocated skull fracture and brief loss of consciousness. Fracture of facial bones without dislocation; deep wound(s) Critical – Cerebral contusion, loss of consciousness for more than 12 hours with intracranial hemorrhaging and other neurological signs; recovery uncertain.
Figure 7: Probability of specific head trauma level based on HIC value
Peak angular velocity was determined as the maximum angular velocity related to peak linear acceleration impact time. Angular velocity values were used to derive Maximum Principal Strain (MPS) (Equation 5), Cumulative Strain Damage Measure (CSDM) (Equation 6), and Brain Rotational Injury Criterion (BrIC) (Equation 7).
Equation 5: Maximum Principal Strain
Equation 6: Cumulative Strain Damage Measure
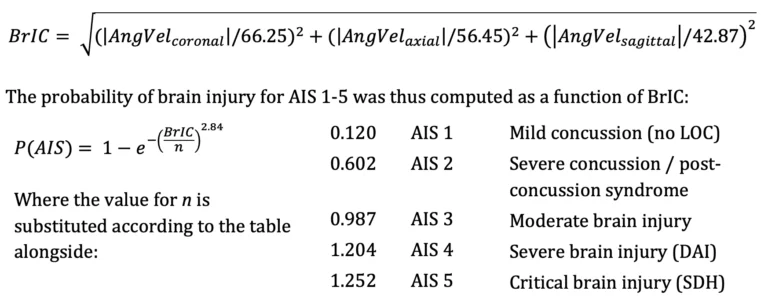
An analysis method validated by Takhounts [6] establishes physical injury criteria for various types of traumatic brain injury and uses Anthropomorphic Test Device (ATD) data to establish a kinematically based brain injury criterion (BrIC) for use with ATD impact testing. This method was utilized to express risk of diffuse brain injury according to the revised AIS scale [7] in terms of peak angular head kinematics, where:
Equation 7: Brain Rotational Injury Criterion
Headrest Impact Results:
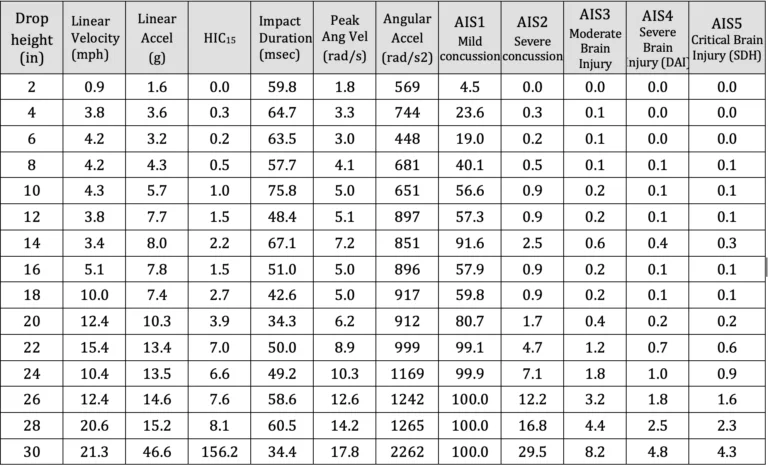
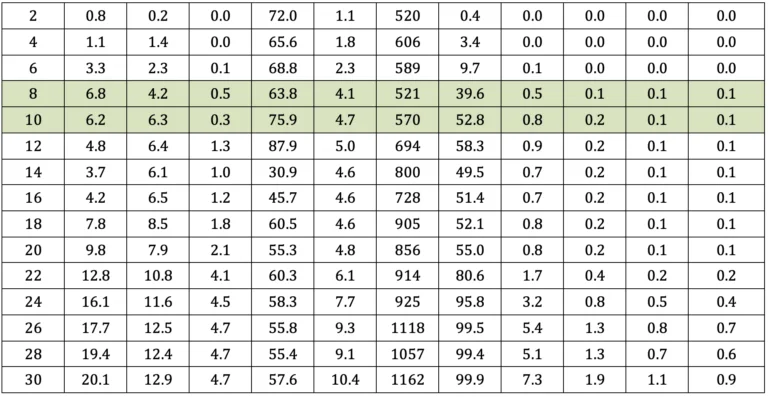
A summary of key results is presented in Table a-d, below. The driver was aware of the pending impact, as he depressed the accelerator in an attempt to avoid the collision in the moments prior to the crash. In rear end collision tests involving human subjects, volunteers instinctively tensed their neck muscles as a protective response. Given that the driver anticipated the crash his neck muscles were likewise expectedly tense as an instinctive protective response. Therefore, the results most consistent with the subject case are presented in Tables a and b. Rows highlighted in green are consistent with change in velocity experienced by the driver during the subject crash.
Table a: Summary of test results – Neck – Stiff; Headrest – lower position
Table b: Summary of test results – Neck – Stiff; Headrest – upper positio
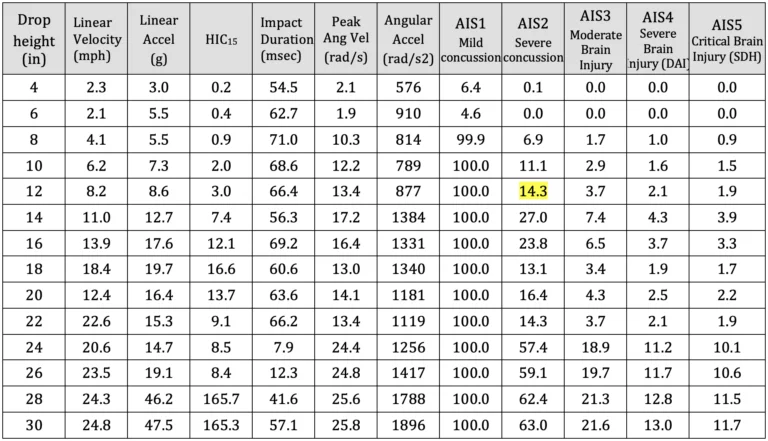
Table c: Summary of test results – Neck – Loose; Headrest – lower position
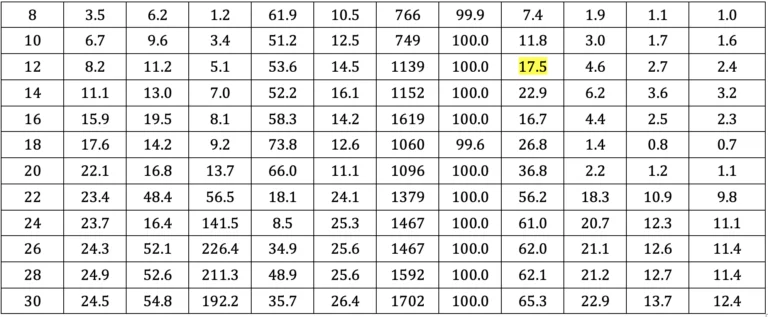
Table d: Summary of test results – Neck – Loose; Headrest – upper position
Skull Fracture
With reference to Ono 8, none of the impact tests approached the occipital skull fracture threshold of 140 g for impacts lasting longer than 7 milliseconds. Therefore, vehicle headrests provide excellent protection against acute skull fractures at impact speeds below 25 mph.
Traumatic Head Injury
With reference to Figure 7 and Tables a-d, maximum recorded HIC values were consistent with a 5 percent or less risk of moderate traumatic head injury. Whereas, the HIC value computed at impact speeds similar to the crash was only 3.4, at which the risk of minor or moderate traumatic head injury is negligible.
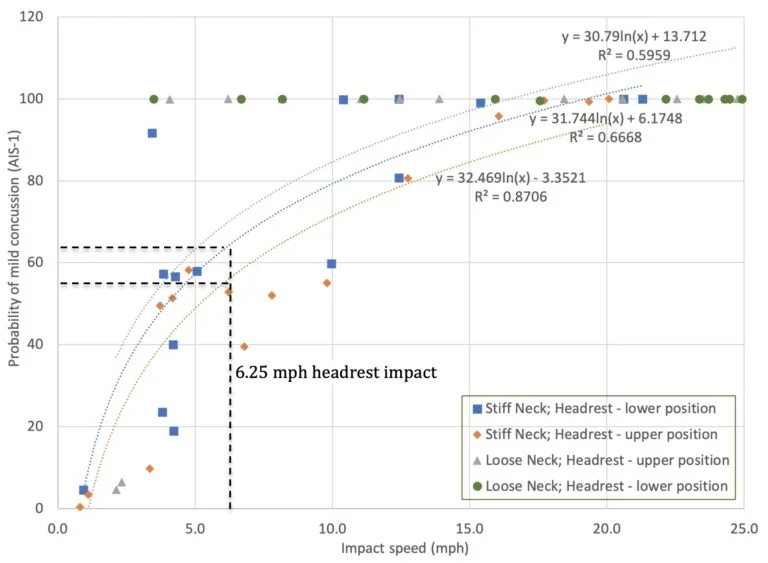
Mild Concussion
With reference to Figure 8 below, the risk of an occupant sustaining a mild concussion in a rear-end collision producing a change in velocity of 6.25 mph (range 5.4 to 7.2 mph) can be determined based on the following calculation: Risk AIS-1 = 31.744*ln(x) + 6.1748 (R2=0.67). The risk of and AIS-1 mild concussion, without post-concussion syndrome, in such an impact is 64.3% (range 59.7 to 68.8%).
Figure 8: Risk of mild concussion (AIS-1) associated with headrest impact
Severe Concussion
With reference to Figure 9, below, the risk of an occupant sustaining a severe concussion in a rear-end collision producing a change in velocity of 6.25 mph (range 5.4 to 7.2 mph) can be determined based on the following calculation: Risk AIS-2 = 0.198e0.234x (R2=0.85). The risk of severe concussion in such an impact is 0.85% (range 0.70 to 1.07%).
Figure 9: Risk of severe concussion (AIS-2) associated with headrest impact
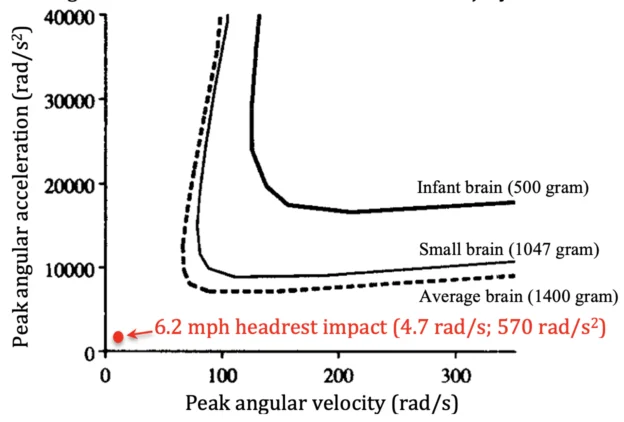
Traumatic Axonal Injury:
Figure 10, below, is adapted from Margulies et al. 20 in which thresholds for axonal injury were developed and published based on mathematical modeling, animal testing and physical experiments. Results from occipital head impact against an exemplar headrest at a speed of 6.2 miles per hour are represented, indicating that rotational head and brain kinematics associated with such impact are well below scientifically-accepted thresholds for traumatic axonal injury.
Figure 10: Scientific Thresholds for Axonal Injury
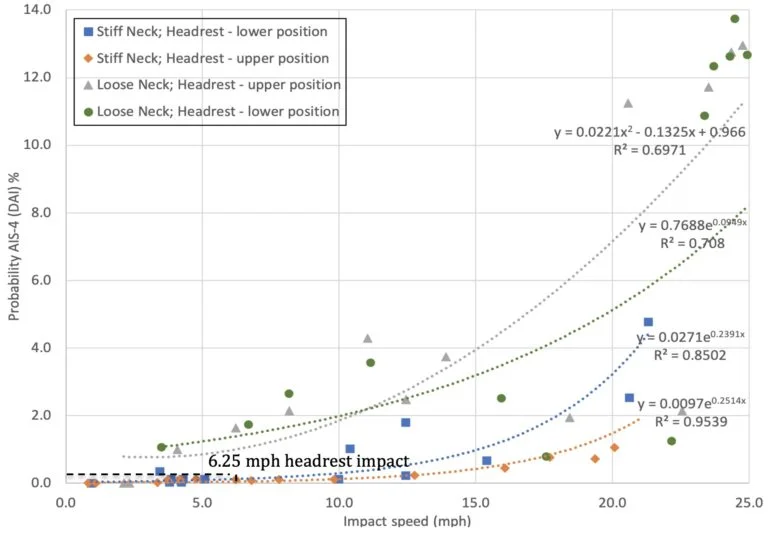
Figure 11, below was generated from data presented in Tables a through d, to present the risk of traumatic axonal injury associated with head impact against an headrest.
Figure 11: Risk of traumatic axonal injury (AIS-4) associated with headrest impact
Results show that the risk of an occupant sustaining traumatic axonal injury in a rear-end collision producing a change in velocity of 6.25 mph (range 5.4 to 7.2 mph) can be determined based on the following calculation: Risk AIS-4 = 0.0271e0.2391x (R2=0.85). The risk of traumatic axonal injury in an impact of the magnitude experienced by the driver is 0.12% (range 0.10 to 0.15%).
Conclusions
Biomechanical testing of head and brain injury risk associated with occipital head impact against a headrest, in accordance with published methods, shows a significant risk (59.7 to 68.8%) of AIS-1 mild concussion, without post-concussion syndrome, in a 6.2 mph rear-end collision. However, the risk of an AIS-2 severe concussion in such an impact decreases to 0.70 to 1.07%, and the risk of traumatic axonal injury is only 0.10 to 0.15%. Moreover, the mechanical traumatic axonal injury is not consistent with a sagittal plane impact.
References
[1] Caccese V, Lloyd J, Ferguson J (2014) An Impact Test Apparatus for Protective Head Wear Testing Using a Hybrid III Head-Neck Assembly. Experimental Techniques.
[2] Lloyd J & Conidi F. (2015). Brain Injury in Sports. Journal of Neurosurgery. October.
[3] Lloyd J. (2017). Biomechanical Evaluation of Motorcycle Helmets: Protection Against Head and Brain Injuries.Journal of Forensic Biomechanics.
[4] SAE (2014) J211/1. Instrumentation for Impact Test – Part 1 – Electronic Instrumentation. Society of Automotive Engineers International, Surface Vehicle Recommended Practice, Warrendale, PA.
[5] Padgaonkar AJ, Krieger KW and King AI. Measurement of Angular Acceleration of a Rigid Body using Linear Accelerometers. J Applied Mechanics. Sept 1975.
[6] Takhounts EG, Craig MJ, Moorhouse K, McFadden J (2013) Development of Brain Injury Criteria (BrIC). Stapp Car Crash Journal 57: 243-266.
[7] Abbreviated Injury Scale (2008) Association for the Advancement of Automotive Medicine, Des Plaines, IL.
Dr. John Lloyd recently conducted a biomechanical study to evaluate motorcycle helmets in terms of their ability to provide protection against traumatic head and brain injuries. Motorcycle helmet testing proves inadequate protection against concussion and diffuse traumatic brain injuries associated.
Motorcycle accident victims account for more than 340,000 fatalities annually, with the United States ranking 8th highest worldwide in the number of motorcycle accident deaths. 75% of all fatal motorcycle accidents involve brain injury, with rotational forces acting on the brain the primary cause of mortality. Current motorcycle helmets are effective at reducing head injuries associated with blunt impact. However, the mechanism of diffuse traumatic brain injury is biomechanically very different.
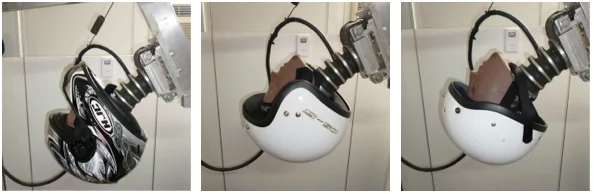
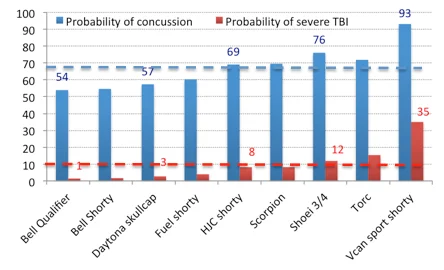
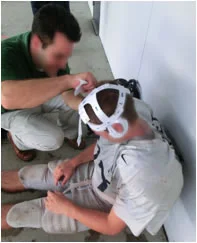
Samples of 9 motorcycle helmet models, representing full-face, three-quarter and shorty designs were evaluated. Helmets, fitted to an instrumented Hybrid III head and neck, were dropped at 13 mph in accordance with DOT motorcycle helmet testing standards.
Results show that, on average, there is a 67% risk of concussion and a 10% probability of severe or fatal brain injury associated with a relatively minor 13mph helmeted head impact.
In conclusion, motorcycle helmets provide inadequate protection against concussion and diffuse traumatic brain injuries associated with even relatively moderate impact.
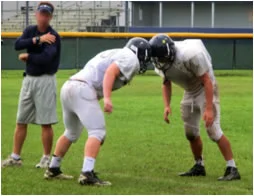
Opportunity to Protect Professional and Youth Sports Players from Traumatic Brain Injuries
Sport concussion researchers teamed up with football players at a Florida high school. Ten players were equipped with Riddell Revolution Speed helmets, with the embedded Simbex HITS encoders, which were worn throughout the 2011/2 football season. The HITS system recorded the severity and location of all head impacts during both football practice sessions and games.
To measure the physiological effects of acute and cumulative head impacts, players agreed to wear a wireless EEG system, which was housed on the back of the shoulder pads. In addition, heart rate variability, respiration rate as well as linear and angular motion was recorded using a Tricorder developed by ReThink Medical.
During the 2011/2- football season, several concussive level impacts were recorded. Two players were removed from the field due to suspected sport concussion / mTBI, one of whom was wearing the complete data acquisition system, including HITS encoders, Nicolet EEG and ReThink Tricorder at the time of impact and for approximately 30 minutes post-impact. For the first time we have the opportunity to investigate physiological responses and brain activity changes in response to a concussive level head impact.
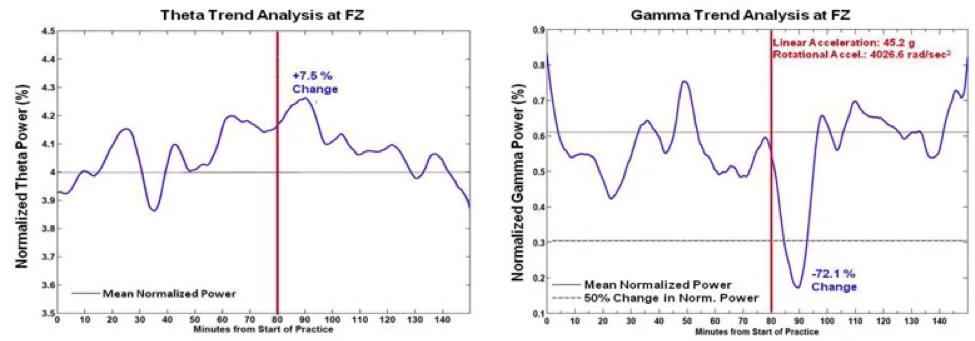
Analysis of one player’s self-reported concussive impact clearly shows decreased Gamma band activity and increased Theta band activity in the frontal cortex of the brain immediately following significant head impact. This suggests that the player had reduced cognitive performance and was perhaps in a ‘drowsy’ state for about 10 minutes following impact. During this time, the player may have been dazed and confused and certainly less effective on the field. But more importantly, his ability to protect himself from a second, potentially harmful impact was greatly compromised.
The findings of our study clearly indicate compromised brain activity as a result of head impact, which appears to be correlated with the magnitude of the impact.
Normalized Power Trend Analysis. Normalized Theta (Left) and Gamma (Right) Power (log of % power within band) of a football player, who experienced a concussion following a moderately forceful head impact (Red line), show phasic modulations in power throughout the practice. Fluctuations in power rarely exceed 25% of the total average power for the recording session in Theta and Gamma frequencies. Yet, immediately following a violent hit (Red line), gamma power begins to decline rapidly and exceeds an arbitrary criterion of ±50% change from average power (peaking at 90 min.). Indeed gamma power remained within 20% of the mean for most of the duration of practice, exceeding this degree of change for over 10 minutes after the impact and two other brief episodes (around 20 min. and 50 min. for less than five minutes; Note, the first and last five minutes were ignored due to the temporal filtering artifact at both edges). Whereas, a peak in theta power coincided with the greatest change in gamma power, the degree of change from the mean normalized power never exceeded 10%. This preliminary data suggests that our algorithms provide (1) the sensitivity to detect significant change in brain activity following a concussive event, and (2) specificity in detecting which frequency band (i.e., gamma) provides the most meaningful brain signal for detecting concussion / brain trauma
Our future goals for the upcoming football season include a new micro-EEG recorder, which is in development, that will allow unobtrusive measurement of several players simultaneously during both football practice and games.
Ultimately, it is our hope that this technology will be widely available to both professional and youth teams so that medical staff can monitor the brain health of players in real-time so that injured participants can be objectively identified, effectively protected and successfully treated.
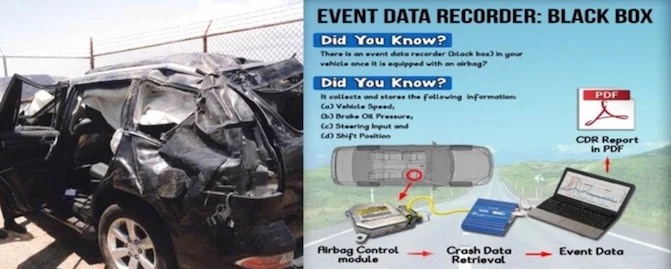
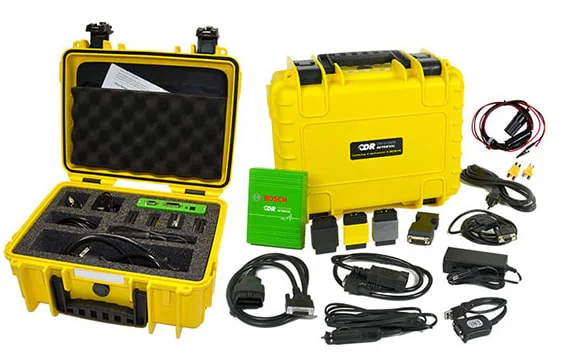
Crash data retrieval (EDR) is a tool used by accident reconstructionists to download pre and post collision information from vehicles to determine driver behavior, impact severity and the cause of the crash.
Much like an airplane, almost all vehicles in the United States are equipped with a ‘black box’. In the event of an impact critical information about the crash as well as pre-crash information is recorded and stored in this black box, also known as an event data recorder (EDR). The process of obtaining this data is known as crash data retrieval.
It is a common misunderstanding that EDR data is only temporarily saved in the vehicle’s ‘black box’ and is erased after a short period of time. In the event of an airbag deployment, EDR data is almost always recorded and permanently stored. This data is never erased. Whereas, in a non-deployment event (i.e. airbags did not go off), if the event meets the manufacturer’s propriety algorithms to trigger recording, that data is saved, but can be overwritten if the vehicle is involved in subsequent collisions.
This information of vital importance when investigating a crash includes:
Speed
Change in Velocity (Delta-v)
Acceleration / Deceleration
Braking
Pre-crash Steering Inputs/ Angle
Seatbelt Usage and airbag deployment
Specialized equipment is required to access the EDR.
Unfortunately, law enforcement investigating a crash typically only retrieve the information from the Crash Data Recorder in the event of a traffic homicide. Hence, it is up to the accident reconstruction experts to download this information from the vehicles.
EDR data can help an accident reconstructionist to determine:
pre-crash driver behavior
crash severity
who was at fault
Combined with his biomechanical expertise, Dr. Lloyd can use the information from the EDR to determine:
occupant kinematics (motion in response to crash)
whether injuries are consistent with crash severity