Motor vehicle accident analysis Dr. John Lloyd has served attorneys nationwide for 25+ years in biomechanics, human factors, helmet testing and motorcycle accident expert
In the United States there are 11 million motor vehicle accidents each year, more than 400,000 of which result in death. The most common injuries resulting from automobile accidents are to the head, brain, neck, and low back. The evaluation of such cases often involves a team of experts, including accident reconstruction, biomechanics and human factors experts.
As an expert witness in biomechanics and human factors as well as a certified accident reconstructionist for motorcycle crashes, automobile accident, and truck collisions, r. John Lloyd is a highly qualified testifying expert witness.
Accident Reconstruction
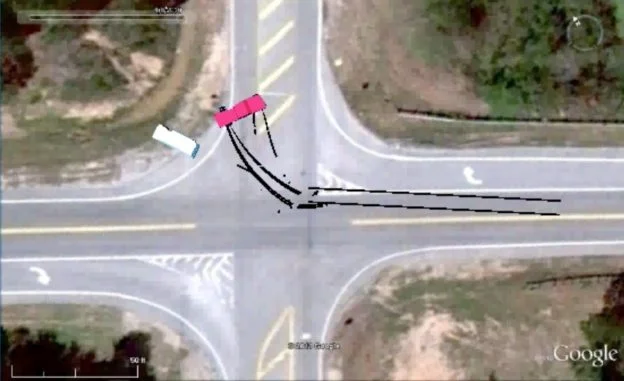
First the accident reconstructionist evaluates the physical evidence from a crash scene, including skid marks, gouges and other roadway markings, along with crush information from the vehicles along with their final rest positions. This evidence is used to calculate the change in velocity of the subject vehicles.
Biomechanical Analysis
The complete anatomy of the crash (pre and post impact vehicle speeds, whether or not seat belts were worn, faulty airbags, etc.) is conveyed to the biomechanics expert.
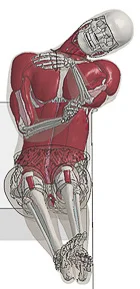
Biomechanists use this information to determine occupant kinematics (motion of the vehicle occupants in response to the impact), kinetics (forces acting on various body parts as a result of the collision) and injury mechanisms. This can include the impact to the head and forces transmitted to the brain, blunt trauma to the low back, and shear forces to the cervical vertebrae. Findings are used to determine whether impact locations and forces provide a causal explanation for claimed injuries. Hence the biomechanist can provide rationale as to whom was at fault for the sustained injuries.
As an expert witness in biomechanics and human factors as well as a certified accident reconstructionist for motorcycle crashes, automobile accidents, truck collisions, in addition to bicycle and pedestrian accidents, Dr. John Lloyd is highly valued expert for the evaluation of motor vehicle crashes.
The following is a case study in which biomechanics expert, Dr. John Lloyd, evaluated the risk of concussion and brain injury associated with headrest impact in rear end crashes.
Headrest Impact Test Apparatus:
In accordance with prior published test methods[1],[2],[3], a test apparatus was constructed to evaluate the biomechanical protection afforded by an exemplar automobile headrest against head and brain injuries during occipital head impacts in a simulated rear-end motor vehicle collision.
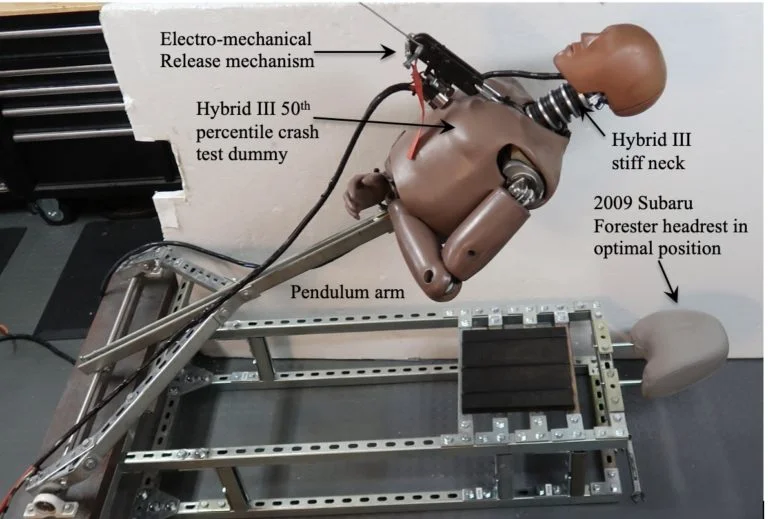
The apparatus involves a pendulum arm, attached by bearing housings to a weighted base. The upper body, including neck and head of a 50th percentile Hybrid III crash test dummy was mounted to the pendulum arm. Data acquisition was initiated by triggering an electromechanical release mechanism, allowing the mannequin to fall, under acceleration due to gravity, until the crash test dummy impacted the headrest and backrest (Figure 1).
Figure 1: Test apparatus
The fundamental elements and principles of this testing have been utilized in other laboratories. By utilizing a Hybrid III neck, the head impact tests are more realistic, causing head rotation at the axis between the head and neck, which produces measures of head and brain angular kinematics. The methods presented herein are based upon standardized test methodologies and published research.
Instrumentation
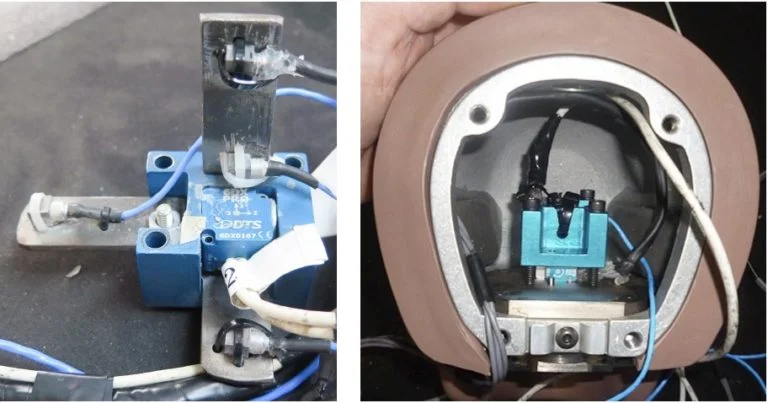
Four PCB Piezotronics tri-axial accelerometers (model # 356A01) were mounted in an X,Y,Z array at the center of mass of the Hybrid III headform, along with a tri-axial angular rate sensor produced by Diversified Technical Systems (composite Figure 2).
Figure 2: Sensor installation in Hybrid III headform
Sensor Calibration:
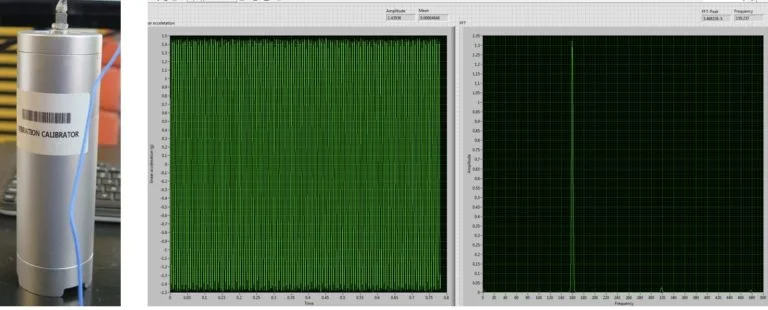
All sensors were calibrated by the manufacturer. Verification of calibration of the linear accelerometers was performed prior to testing using a calibration shaker. Results indicate that the sensors were operating in the specified frequency range and output (Figure 3).
Figure 3: Pre-test verification of linear accelerometer sensors
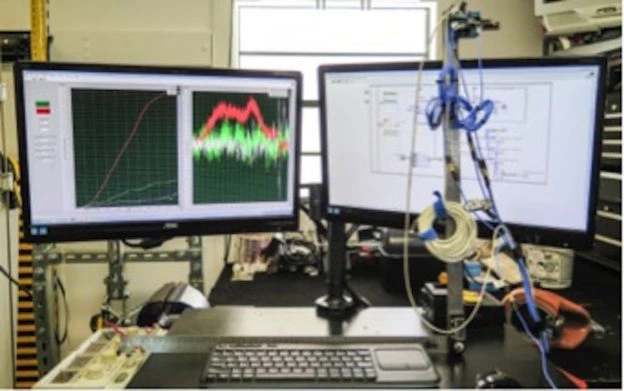
For the angular rate sensor, a simple validation method was devised in which the sensor was affixed to a digital goniometer that was rotated through a 90-degree angle. Using LabVIEW software, the integral of angular rate was computed, reflecting concurrence with the digital goniometer for all three planes of motion (Figure 4).
Figure 4: Pre-test validation of angular rate sensor calibration
Headrest Impact Testing:
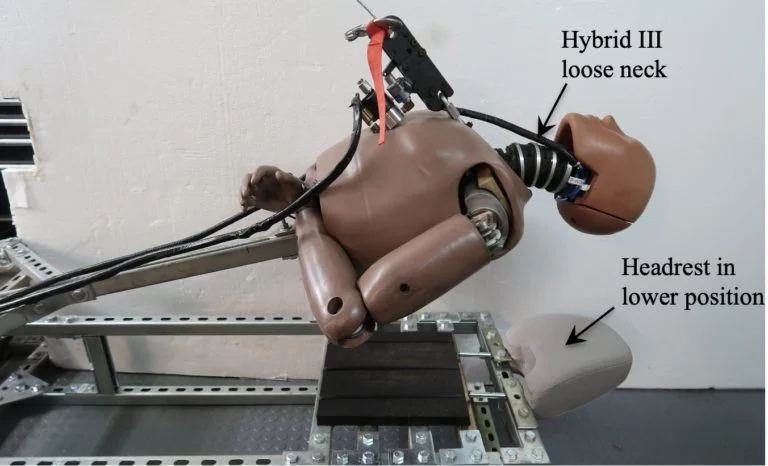
The mannequin head was raised from the headrest in 2-inch increments from 2 inches to 30 inches, generating head impact speeds from 1 to 25 miles per hour. Two headrest positions were evaluated, along with two different Hybrid III necks representative of a stiff and relaxed neck (Figure 5), for a total of sixty tests.
Figure 5: Test apparatus with Hybrid III loose neck and headrest in lower position
Data Acquisition and Analysis:
Data from the analog sensors were acquired in accordance with SAE J211 [4], using a National Instruments compact DAQ data acquisition system and LabVIEW software (National Instruments, Austin, TX). The raw data was then filtered in MATLAB (The MathWorks, Natick, MA) using a phaseless eighth-order Butterworth filter with cutoff frequencies of 1650 Hz and 300Hz for the linear accelerometers and angular rate sensors, respectively.
Angular acceleration values for sagittal, coronal and axial planes were computed from the angular velocity data using the 5-point central difference by least squares method (Equation 1):
Equation 1: Five-point central difference by least squares method
Angular acceleration vales were also derived from the array of linear accelerometers, by the mathematical method documented by Padgaonkar et al [5].
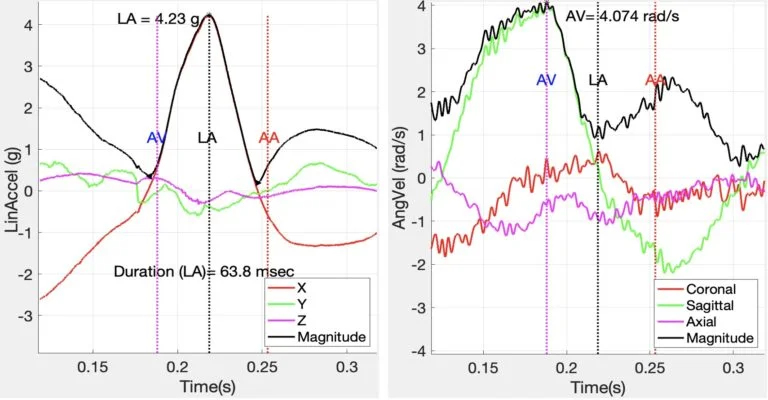
Linear velocity was calculated by integrating linear acceleration. Mathematical methods were performed using Matlab to compute characteristic values from variables of interest. Figure 6, below illustrates peak linear acceleration and angular velocity associated with a 6.8 mph occipital head impact against a headrest.
Figure 6: Linear acceleration and angular velocity associated with headrest impact
It is noted that the major component of linear acceleration was in the X-axis (anterior-posterior), while the major component of angular velocity was in the sagittal plane, as expected.
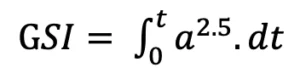
Linear acceleration values were used to calculate Maximum Pressure (Equation 2), Gadd Severity Index (GSI) (Equation 3), and Head Injury Criterion (HIC15) (Equation 4).
Equation 2: Maximum Pressure
Equation 3: Gadd Severity Index
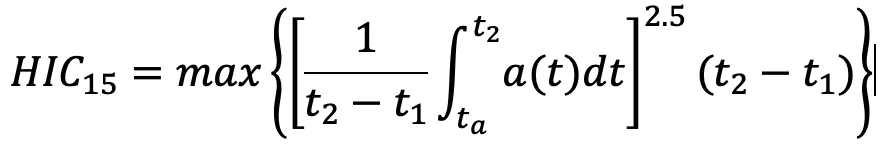
The Head Injury Criterion (HIC) is an empirical measure of impact severity describing the relationship between the linear acceleration magnitude, duration of impact and the risk of head trauma (Equation 4).
Equation 4: Head Injury Criterion
where a is resultant head acceleration, t2-t1 < 15 msec
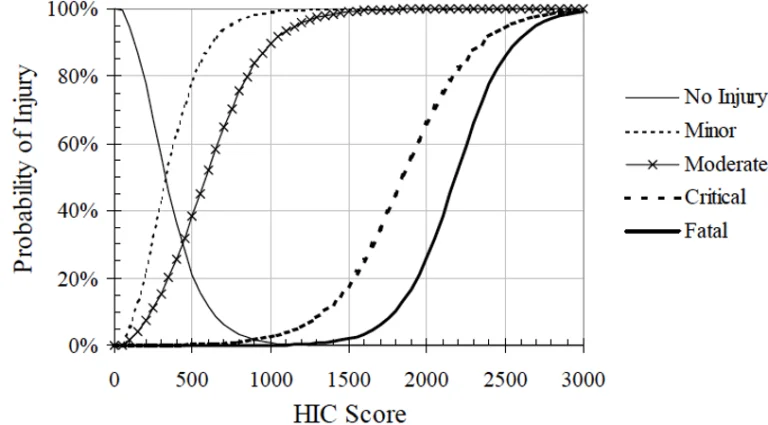
With reference to the Figure 7, below, the HIC value is used to predict the risk of head trauma: Minor –skull trauma without loss of consciousness; nose fracture; superficial injuries Moderate – skull trauma with or without dislocated skull fracture and brief loss of consciousness. Fracture of facial bones without dislocation; deep wound(s) Critical – Cerebral contusion, loss of consciousness for more than 12 hours with intracranial hemorrhaging and other neurological signs; recovery uncertain.
Figure 7: Probability of specific head trauma level based on HIC value
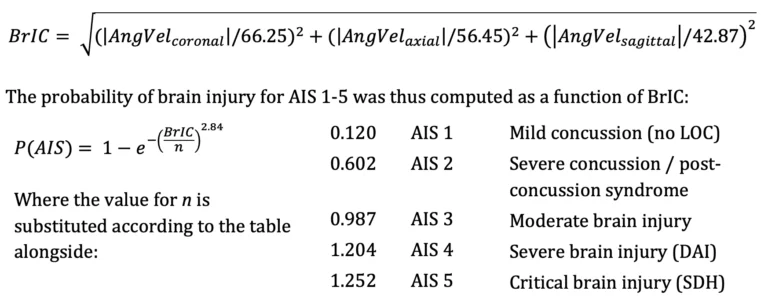
Peak angular velocity was determined as the maximum angular velocity related to peak linear acceleration impact time. Angular velocity values were used to derive Maximum Principal Strain (MPS) (Equation 5), Cumulative Strain Damage Measure (CSDM) (Equation 6), and Brain Rotational Injury Criterion (BrIC) (Equation 7).
Equation 5: Maximum Principal Strain
Equation 6: Cumulative Strain Damage Measure
An analysis method validated by Takhounts [6] establishes physical injury criteria for various types of traumatic brain injury and uses Anthropomorphic Test Device (ATD) data to establish a kinematically based brain injury criterion (BrIC) for use with ATD impact testing. This method was utilized to express risk of diffuse brain injury according to the revised AIS scale [7] in terms of peak angular head kinematics, where:
Equation 7: Brain Rotational Injury Criterion
Headrest Impact Results:
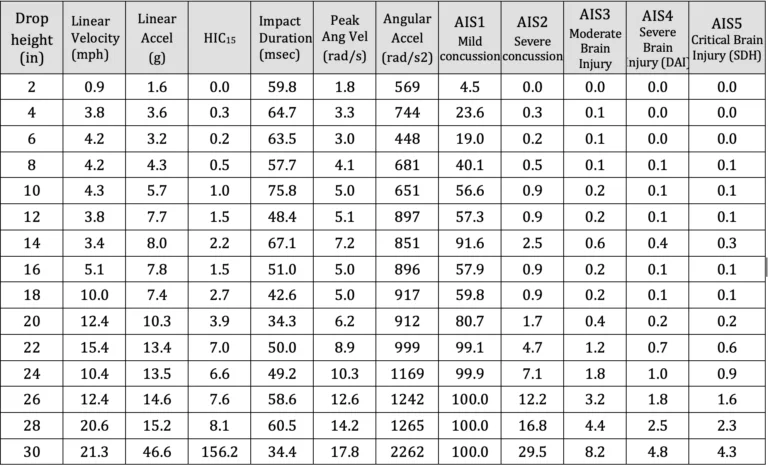
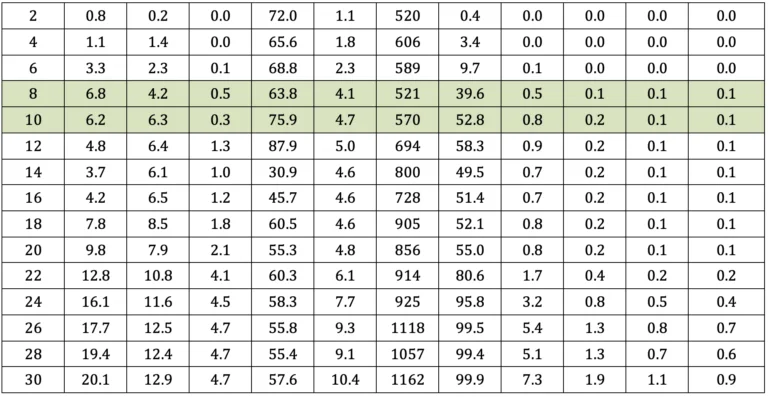
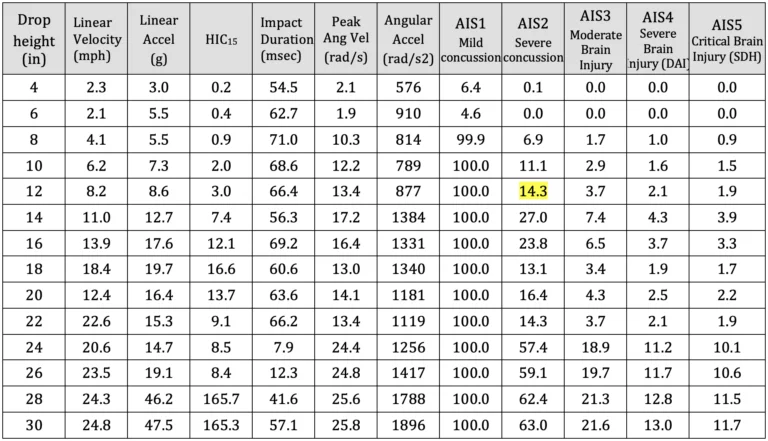
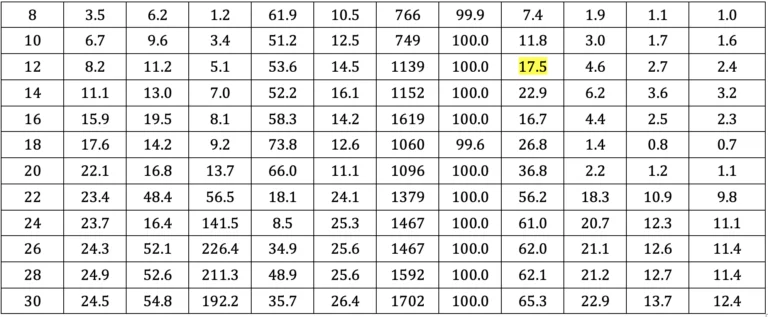
A summary of key results is presented in Table a-d, below. The driver was aware of the pending impact, as he depressed the accelerator in an attempt to avoid the collision in the moments prior to the crash. In rear end collision tests involving human subjects, volunteers instinctively tensed their neck muscles as a protective response. Given that the driver anticipated the crash his neck muscles were likewise expectedly tense as an instinctive protective response. Therefore, the results most consistent with the subject case are presented in Tables a and b. Rows highlighted in green are consistent with change in velocity experienced by the driver during the subject crash.
Table a: Summary of test results – Neck – Stiff; Headrest – lower position
Table b: Summary of test results – Neck – Stiff; Headrest – upper positio
Table c: Summary of test results – Neck – Loose; Headrest – lower position
Table d: Summary of test results – Neck – Loose; Headrest – upper position
Skull Fracture
With reference to Ono 8, none of the impact tests approached the occipital skull fracture threshold of 140 g for impacts lasting longer than 7 milliseconds. Therefore, vehicle headrests provide excellent protection against acute skull fractures at impact speeds below 25 mph.
Traumatic Head Injury
With reference to Figure 7 and Tables a-d, maximum recorded HIC values were consistent with a 5 percent or less risk of moderate traumatic head injury. Whereas, the HIC value computed at impact speeds similar to the crash was only 3.4, at which the risk of minor or moderate traumatic head injury is negligible.
Mild Concussion
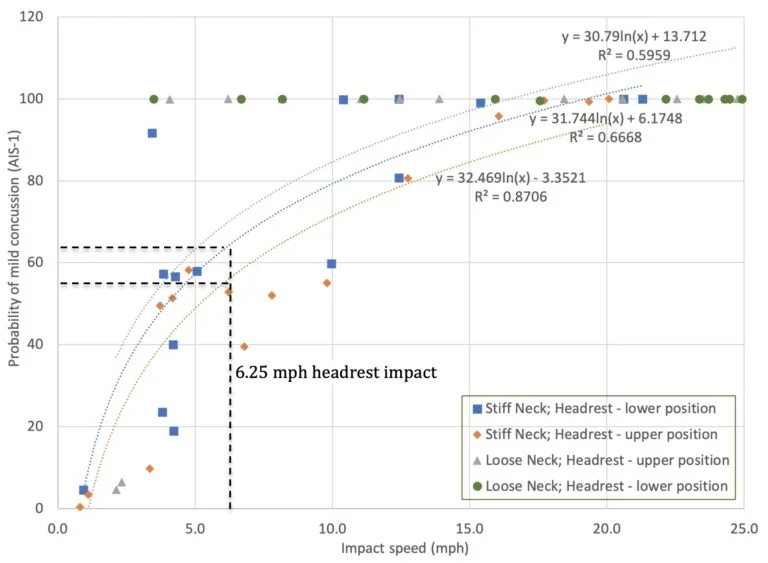
With reference to Figure 8 below, the risk of an occupant sustaining a mild concussion in a rear-end collision producing a change in velocity of 6.25 mph (range 5.4 to 7.2 mph) can be determined based on the following calculation: Risk AIS-1 = 31.744*ln(x) + 6.1748 (R2=0.67). The risk of and AIS-1 mild concussion, without post-concussion syndrome, in such an impact is 64.3% (range 59.7 to 68.8%).
Figure 8: Risk of mild concussion (AIS-1) associated with headrest impact
Severe Concussion
With reference to Figure 9, below, the risk of an occupant sustaining a severe concussion in a rear-end collision producing a change in velocity of 6.25 mph (range 5.4 to 7.2 mph) can be determined based on the following calculation: Risk AIS-2 = 0.198e0.234x (R2=0.85). The risk of severe concussion in such an impact is 0.85% (range 0.70 to 1.07%).
Figure 9: Risk of severe concussion (AIS-2) associated with headrest impact
Traumatic Axonal Injury:
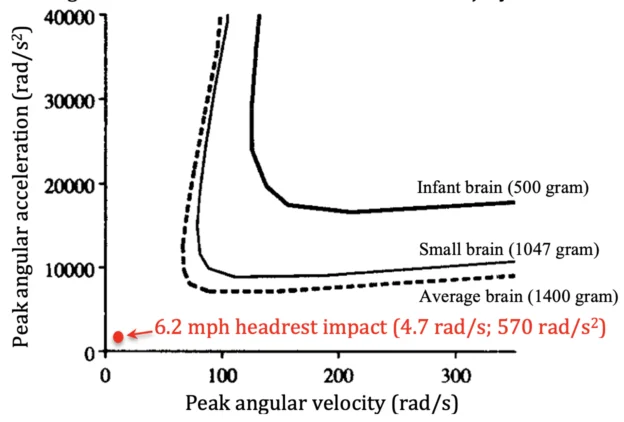
Figure 10, below, is adapted from Margulies et al. 20 in which thresholds for axonal injury were developed and published based on mathematical modeling, animal testing and physical experiments. Results from occipital head impact against an exemplar headrest at a speed of 6.2 miles per hour are represented, indicating that rotational head and brain kinematics associated with such impact are well below scientifically-accepted thresholds for traumatic axonal injury.
Figure 10: Scientific Thresholds for Axonal Injury
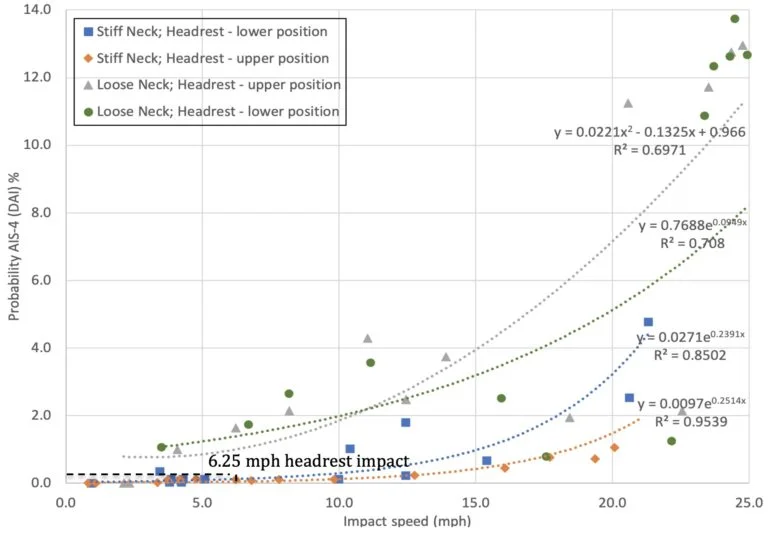
Figure 11, below was generated from data presented in Tables a through d, to present the risk of traumatic axonal injury associated with head impact against an headrest.
Figure 11: Risk of traumatic axonal injury (AIS-4) associated with headrest impact
Results show that the risk of an occupant sustaining traumatic axonal injury in a rear-end collision producing a change in velocity of 6.25 mph (range 5.4 to 7.2 mph) can be determined based on the following calculation: Risk AIS-4 = 0.0271e0.2391x (R2=0.85). The risk of traumatic axonal injury in an impact of the magnitude experienced by the driver is 0.12% (range 0.10 to 0.15%).
Conclusions
Biomechanical testing of head and brain injury risk associated with occipital head impact against a headrest, in accordance with published methods, shows a significant risk (59.7 to 68.8%) of AIS-1 mild concussion, without post-concussion syndrome, in a 6.2 mph rear-end collision. However, the risk of an AIS-2 severe concussion in such an impact decreases to 0.70 to 1.07%, and the risk of traumatic axonal injury is only 0.10 to 0.15%. Moreover, the mechanical traumatic axonal injury is not consistent with a sagittal plane impact.
References
[1] Caccese V, Lloyd J, Ferguson J (2014) An Impact Test Apparatus for Protective Head Wear Testing Using a Hybrid III Head-Neck Assembly. Experimental Techniques.
[2] Lloyd J & Conidi F. (2015). Brain Injury in Sports. Journal of Neurosurgery. October.
[3] Lloyd J. (2017). Biomechanical Evaluation of Motorcycle Helmets: Protection Against Head and Brain Injuries.Journal of Forensic Biomechanics.
[4] SAE (2014) J211/1. Instrumentation for Impact Test – Part 1 – Electronic Instrumentation. Society of Automotive Engineers International, Surface Vehicle Recommended Practice, Warrendale, PA.
[5] Padgaonkar AJ, Krieger KW and King AI. Measurement of Angular Acceleration of a Rigid Body using Linear Accelerometers. J Applied Mechanics. Sept 1975.
[6] Takhounts EG, Craig MJ, Moorhouse K, McFadden J (2013) Development of Brain Injury Criteria (BrIC). Stapp Car Crash Journal 57: 243-266.
[7] Abbreviated Injury Scale (2008) Association for the Advancement of Automotive Medicine, Des Plaines, IL.
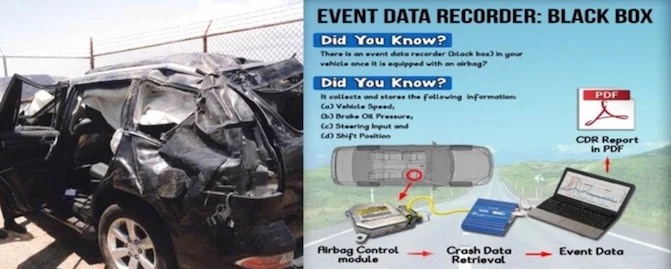
Crash data retrieval (EDR) is a tool used by accident reconstructionists to download pre and post collision information from vehicles to determine driver behavior, impact severity and the cause of the crash.
Much like an airplane, almost all vehicles in the United States are equipped with a ‘black box’. In the event of an impact critical information about the crash as well as pre-crash information is recorded and stored in this black box, also known as an event data recorder (EDR). The process of obtaining this data is known as crash data retrieval.
It is a common misunderstanding that EDR data is only temporarily saved in the vehicle’s ‘black box’ and is erased after a short period of time. In the event of an airbag deployment, EDR data is almost always recorded and permanently stored. This data is never erased. Whereas, in a non-deployment event (i.e. airbags did not go off), if the event meets the manufacturer’s propriety algorithms to trigger recording, that data is saved, but can be overwritten if the vehicle is involved in subsequent collisions.
This information of vital importance when investigating a crash includes:
Speed
Change in Velocity (Delta-v)
Acceleration / Deceleration
Braking
Pre-crash Steering Inputs/ Angle
Seatbelt Usage and airbag deployment
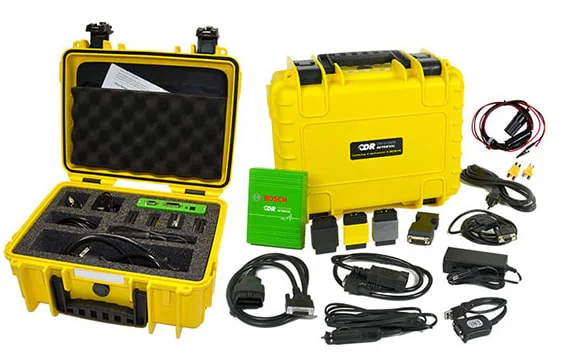
Specialized equipment is required to access the EDR.
Unfortunately, law enforcement investigating a crash typically only retrieve the information from the Crash Data Recorder in the event of a traffic homicide. Hence, it is up to the accident reconstruction experts to download this information from the vehicles.
EDR data can help an accident reconstructionist to determine:
pre-crash driver behavior
crash severity
who was at fault
Combined with his biomechanical expertise, Dr. Lloyd can use the information from the EDR to determine:
occupant kinematics (motion in response to crash)
whether injuries are consistent with crash severity

 The complete anatomy of the crash (pre and post impact vehicle speeds, whether or not seat belts were worn, faulty airbags, etc.) is conveyed to the biomechanics expert.