Accident reconstruction expert Dr. John Lloyd has served attorneys nationwide for 25+ years in biomechanics, human factors, helmet testing and motorcycle expert
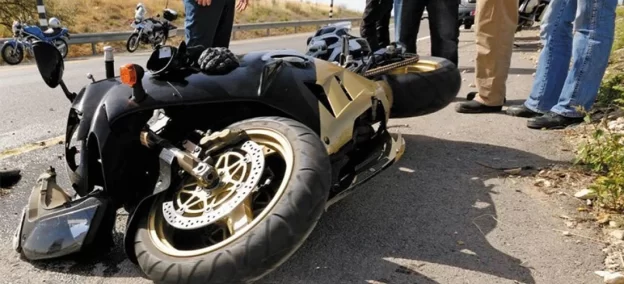
A solo motorcycle crash is one of the leading causes of motorcycle accidents. These accidents are unique in that, typically, no other vehicles are involved. Oftentimes the root cause is rider error due to the fact that motorcycles are considerable more complex to operate than passenger vehicles. Discover how to avoid solo motorcycle crashes with valuable insights from a motorcycle expert.
Riders involved in a solo motorcycle crash typically fit one of two categories:
Riding too fast
Inadequate experience
The first category speaks for itself. Riding too fast for conditions reduces time and distance available to respond safely to potential hazards, such as other roadway users.
Lack of experience includes lack of appropriate training or failure to maintain training. Many riders purchase an expensive motorcycle – far too powerful and heavy for their riding abilities – and ride less than 3000 miles per year – generally in a straight line. When they are faced with a hazard, they panic and make poor choices, all too often resulting in injury or death.
Motorcycle Braking
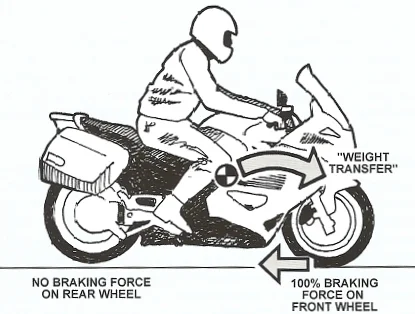
Unlike cars, the front and rear brake systems on a motorcycle are typically independent — the front brake is operated by a lever on the right side of the handlebar, while the rear brake is operated by a foot pedal, also on the right side. As car drivers we learn that hard braking is performed by the right foot. However, doing so on a motorcycle will inevitably lead to trouble. In fact, about 70 percent of the braking power on a motorcycle comes from the front brake lever.
As front brake force increases weight transfers to the front tire, increasing the tire force acting on the road surface, which permits application of even greater front brake force.
However, sudden over-braking on the front, on a motorcycle not equipped with ABS, can produce a front-tire skid, which can cause loss of control in under one second. So, for an inexperienced rider it can be challenging to find the ‘sweet-spot’ between hard braking and over-braking on the front tire.
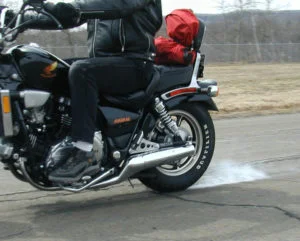
Whereas, utilization of the rear brake without the front brake produces only 30% braking efficiency and can cause the rear end of the motorcycle to skid and ‘fishtail’, due to the fact that there is generally less weight and a larger contact area (less pressure) on the rear tire.
Experienced motorcyclists learn to use both the front and rear brakes in unison and, together both brakes can out-perform the stopping power of most other roadway vehicles.
Motorcycle Steering
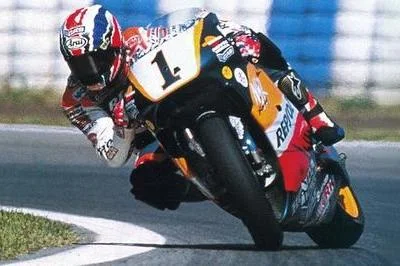
Motorcycles also differ from other vehicles in the way that they steer. In a car if you want to go right you turn the steering wheel to the right and visa versa. Whereas, on a motorcycle if you want to go right you turn the handlebar to the left. On the surface this appears to be counter-intuitive. However, due to the geometry of motorcycles, when you turn the handlebar in one direction, the bike will lean in the opposite direction. It is this lean that causes the motorcycle to turn. This phenomenon is called counter-steering.
To turn a tighter curve you simply increase the lean angle. Modern sport motorcycles are capable of lean angles up to 60 degrees, allowing motorcycle racers to turn corners at high speeds. However, most curves on public roads don’t require more than 15 degree lean angle, which is generally the comfort limit of many novice riders.
Motorcycles are highly sensitive to changes in roadway conditions. Potholes can destabilize a motorcycle, causing the rider to lose control. The following is a case in which a rider claimed he was traveling at only 15 miles per hour, when he came upon a large pothole in the roadway and lost control. The motorcycle fell to the right, with the right foot peg penetrating the rider’s leg, leading to a near amputation of his right foot. Dr. Lloyd was retained to investigate the cause of the motorcycle pothole crash.
Test Instrumentation
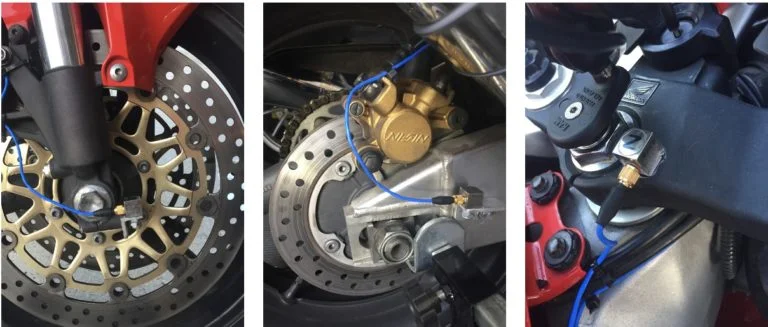
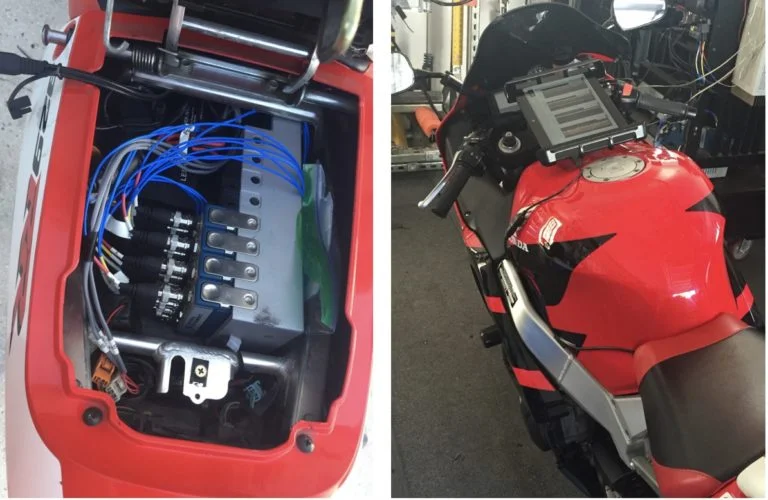
An exemplar Honda CBR 929RR motorcycle was acquired and instrumented with accelerometers installed on the front axle, rear axle and handlebars:
Data acquisition was controlled using a National Instruments cDAQ 9178 and acquired at 10 kHz per channel on a Windows tablet running LabVIEW software:
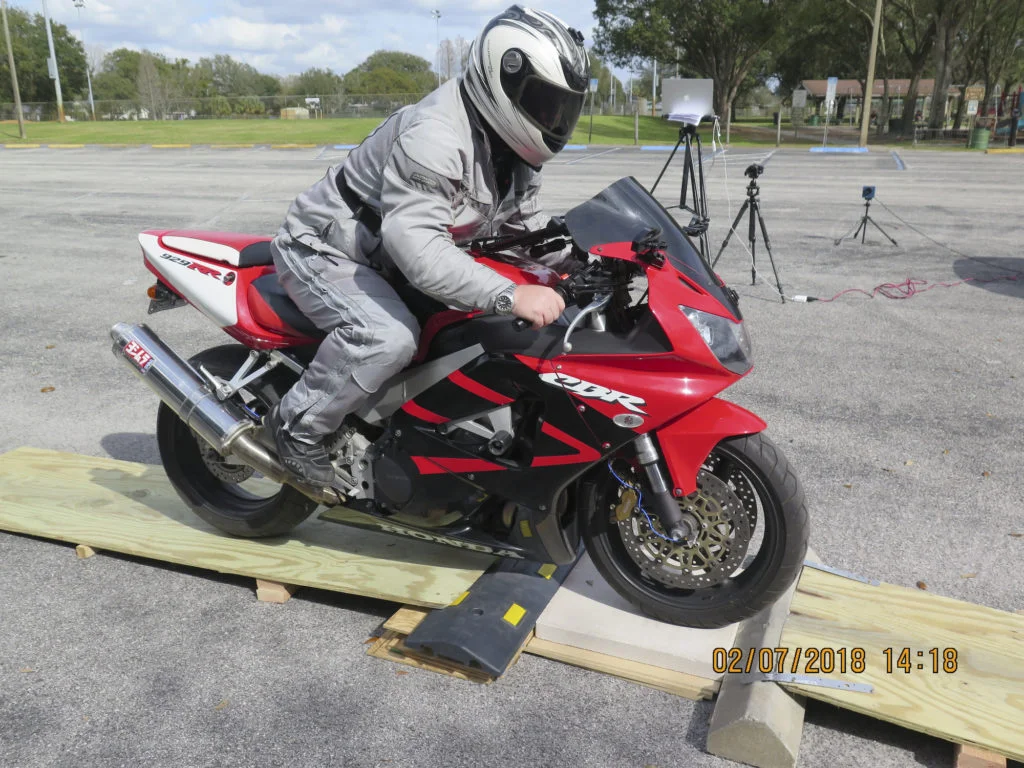
Pothole Crash Testing
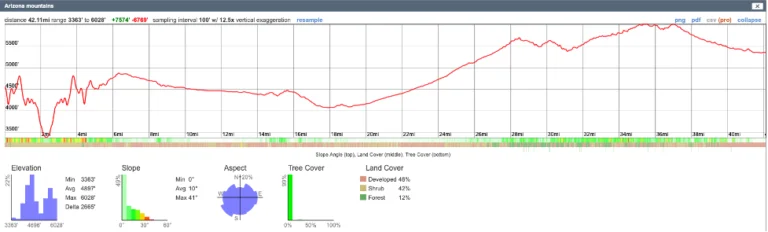
Using the instrumented motorcycle, Dr. Lloyd constructed an exemplar pothole in an open parking lot using ramps to investigate how the length and depth of the pothole affected stability of the motorcycle. In addition to sensors, testing was recorded using high speed and standard video, as well as GoPro cameras mounted on the motorcycle
Results
Based on analyses and physical evidence, that the speed of the motorcycle while crossing the roadway defect was likely 14 -18 miles per hour. At such speeds, the front and rear suspensions have a tendency to approach maximum compression. along with substantial deformation of the tires.
Conclusions
Dr. Lloyd determined that the motorcycle crash was caused due to the motorcycle accelerating as it crossed the pothole. When the rear wheel crossed the fore edge of the defect it lost contact with the roadway and the rear wheel speed increased without resistance. Upon contact with the aft edge of the roadway defect the rear wheel was at a higher rate of speed than the rest of the motorcycle, causing the motorcycle to unexpectedly wheelie.
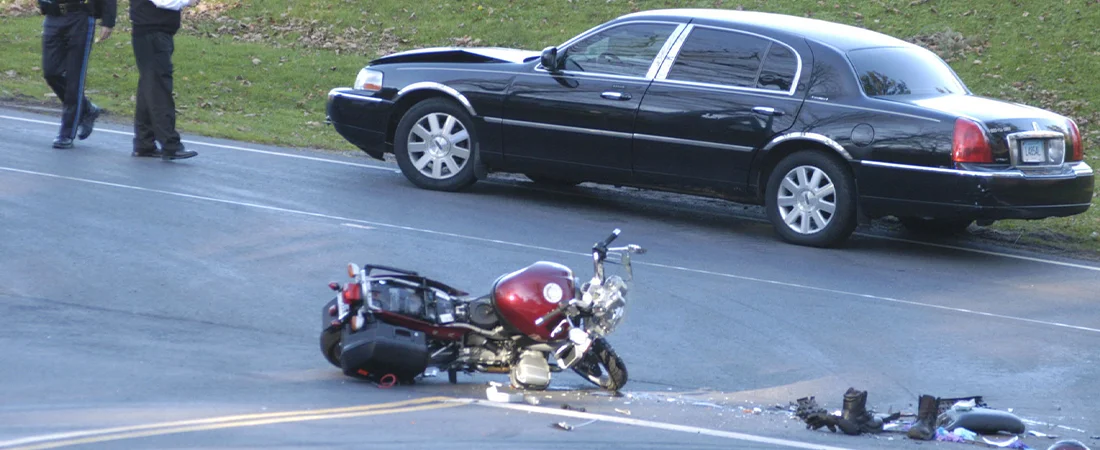
The number one cause of motorcycle crashes involving other vehicles is a left-turning driver across the rider’s path. In every case, the intruding motorist explains that they “did not see the approaching motorcycle”. The motorcycle was not conspicuous.
Expectancy
How can a motorist fail to see something as large as a modern motorcycle? The answer – expectancy. According to the National Highway Transportation Safety Authority (NHTSA), motorcycles account for only 0.6% of total vehicle miles traveled in the United States. Thus, motorists have more than a 99% expectancy that the next vehicle they see will NOT be a motorcycle. Through experiential learning drivers have learned to look for other automobiles, not motorcycles.
It is not that a motorist does not see the motorcycle. However, it does not meet their expectation and therefore they may fail to identify the approaching motorcycle.
What can motorcyclists do to reduce their risk of collision when a driver causes a path obstruction at an intersection? According to human factors research, roadway users respond to hazards based on available information. They fail to respond when the available information is insufficient. Based on my experience as a motorcycle rider and human factor expert, conspicuity is key to increasing the information available to motorists. As motorcyclists we need to take responsibility to make our presence known to other roadway users.
Many opportunities to improve conspicuity are available, which generally fall into two categories – audible and visual. Many riders are familiar with the concept “Loud pipes save lives”, as often declared on stickers affixed to their helmets. However, since noise intensity decreases as a function of the distance-squared, loud pipes are only effective in close proximity. Moreover, the greater volume is actually behind the motorcycle, not in front.
Human Factors research teaches that to improve driver detection and therefore avoidance of motorcycles on the road, we can enhance our visual conspicuity by following a few simple guidelines. These are captured by the acronym CAPLETS, which includes Contrast, Anticipation, Pattern, Lighting, Eccentricity, Time of Exposure, and Size.
Conspicuous Contrast
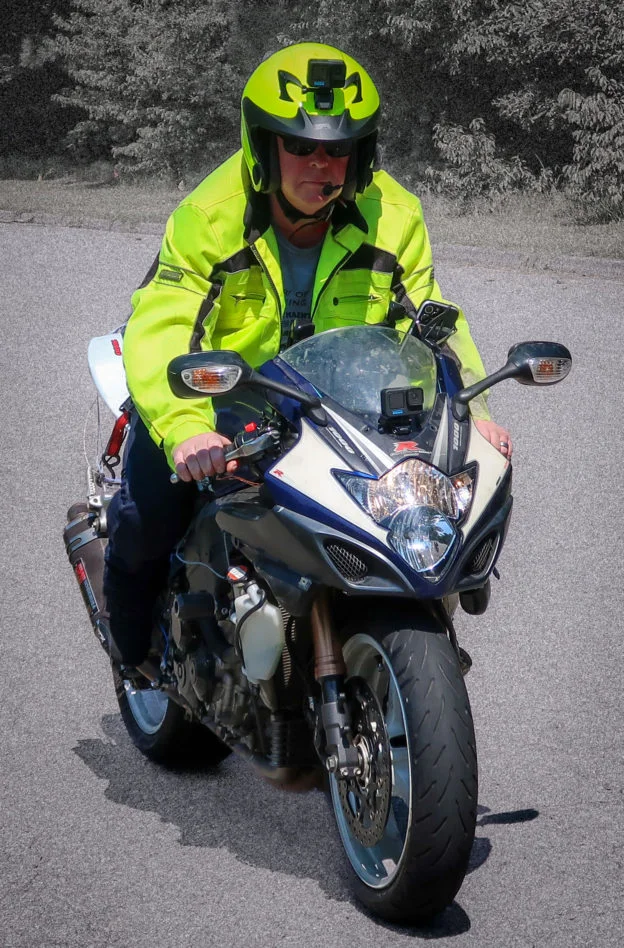
Contrast addresses the ability of a motorcycle and rider to stand out from their environment. For example, a black motorcycle on an asphalt surface is more difficult to distinguish than a yellow or red bike, especially under nighttime conditions. The same is true for the rider. Dark clothing makes it more difficult for a motorcyclist to be detected on the roadway. Brighter colors, especially high-vis yellow or orange, are more likely to create a greater contrast and therefore be more recognizable.
Anticipation Conspicuity
Anticipation refers to the expectation of a given event. When motorcyclists ride together in a group, motorists are more likely to expect and therefore look for additional motorcycles. For this reason, a group riding together is often safer than a solo motorcyclist traveling alone.
Conspicuous Patterns
Patterns aid recognition by relying on one’s past experiences. Obviously, most motorists are familiar with the shape or pattern of a motorcycle and can easily distinguish one during daytime conditions. However, at night the pattern exhibited by a single headlight, may not aid a driver in identifying an approaching motorcycle. Motorcycles equipped with additional lighting that outlines its shape are more likely to be recognized on the roadway and hence less likely that their path will be intruded by a motorist.
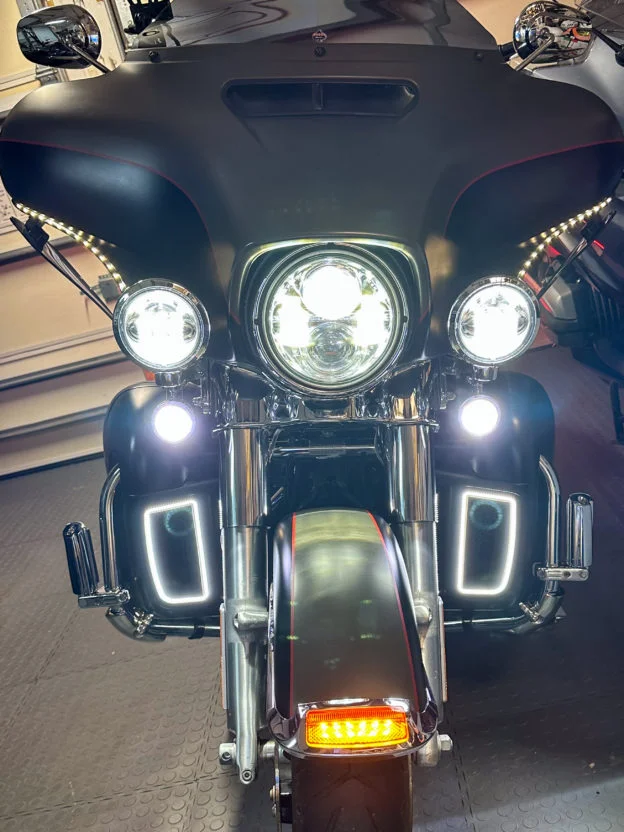
Conspicuous Lighting
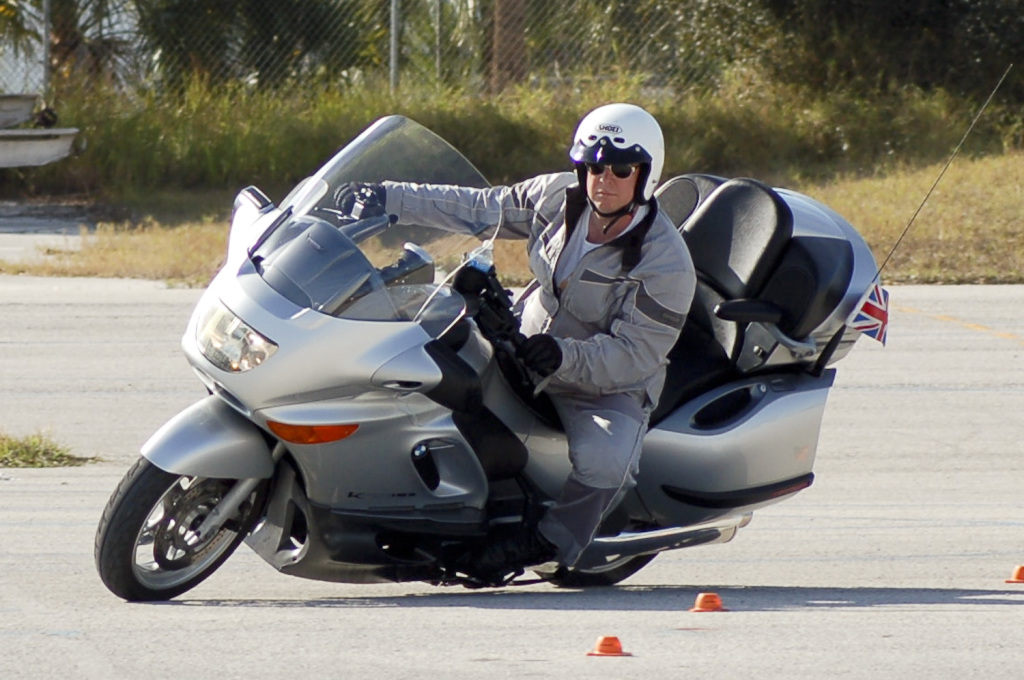
The purpose of Lighting is somewhat self-explanatory. More lighting means more information for other roadway users. Lighting is beneficial not just at night, but also during the day. The photograph, below, of one of my motorcycles illustrates how effective additional lighting is in providing information necessary to motorists to recognize my presence on a motorcycle. Headlight modulators can also increase conspicuity by switching between low and high beam automatically at a rate of approximately 4 times per second. The modulators are equipped with a light sensor, which turns off this feature at night. I have personally installed headlight modulators on several of my bikes and can attest as to their effectiveness.
Eccentricity
Eccentricity relates to the viewing angle. When a motorcycle is approaching an intersection, the viewing angle of the rider to an automobile on the right, waiting to make a left turn across the roadway is close to zero. Whereas, for the driver at the road junction, their viewing angle, unless properly turning their head to look for oncoming vehicles, is close to 90 degrees. There is not much that a rider can do to improve the motorists viewing angle. However, I have found that, when approaching an intersection at which a driver is waiting to make a turn across my path, by moving my motorcycle side to side within my lane helps to catch their attention.
Time of Exposure
Time of Exposure. It is critically important at intersections to ensure that no visual obstructions exist between the rider and motorist that could limit time available to detect your presence. If fixed obstructions, such as trees or signage, are present I will position my motorcycle in a manner that provides a clear line of sight. Whereas, if a vehicle in front of or to the right of my motorcycle may pose a potential visual obstruction at an approaching intersection, I will move forward, or drop back, allowing a clear 3-second window between myself and other vehicles, thereby affording a waiting motorist every opportunity to detect and identify me on the road. Speed can also negatively affect time of exposure. At greater speeds other drivers have less available time to detect a motorcyclists presence. For this reason, I advise that it is best to travel at or within 5 mph of the posted speed limit.
Conspicuous Size
Size matters, when it comes to conspicuity. Remember that motorists are looking for other automobiles. Larger motorcycles tend to be identified more quickly than smaller bikes, or bicycles. An opportunity may exist to make your motorcycle appear larger than reality through the use of additional lighting, such as led lights mounted on left and right side mirrors, and/or by the front wheel axle.
Crashes involving motorcycles are unique due to the manner in which they respond to different roadway hazards. Motorcycle inspection and testing may be a necessary component of a motorcycle crash analysis. Dr. John Lloyd has extensive expertise in motorcycle inspection and testing.
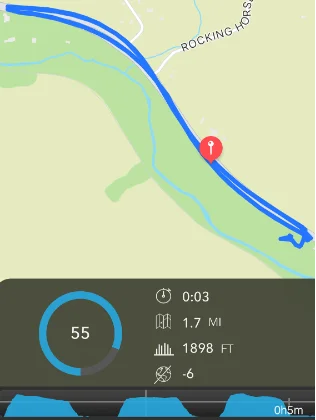
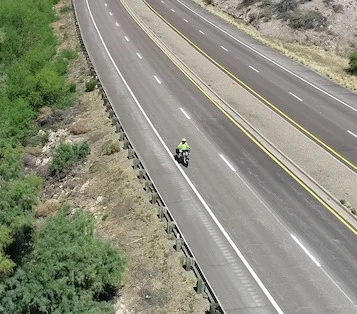
Exemplar motorcycles are typically rented and outfitted with instrumentation to measure acceleration, braking efficiency, lean angle, as well as GPS tracking and multiple GoPro cameras. Dr. Lloyd will ride through the crash scene on the instrumented motorcycle to document the rider’s view along with the motorcycle handling characteristics. A drone may also be used to capture an aerial view. This information has proven to be invaluable in the analysis of motorcycle crash cases.
GoPro camera viewlean angle dataDrone aerial viewESR data
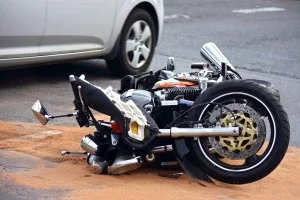
One particular motorcycle crash case involved loss of control due to a pothole in the road. The motorcycle fell on the rider, resulting in near amputation of his right foot. A thorough description of Dr. Lloyd’s comprehensive motorcycle inspection and testing in that case can be found here.
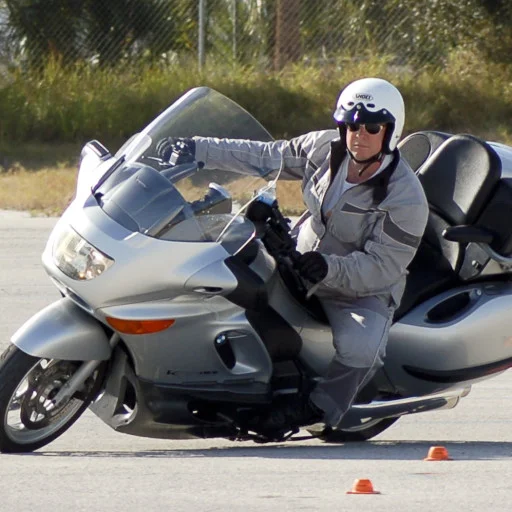
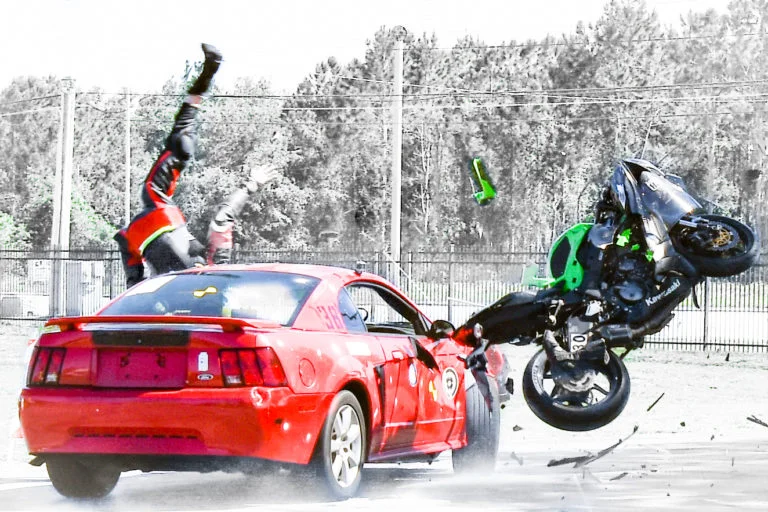
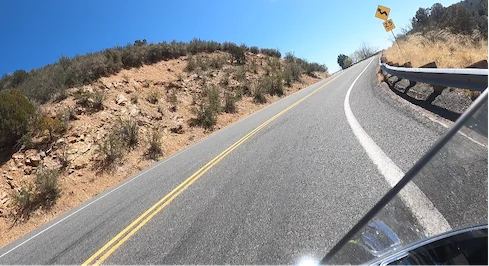
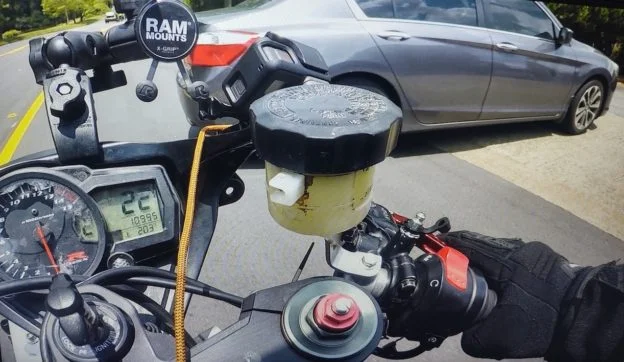
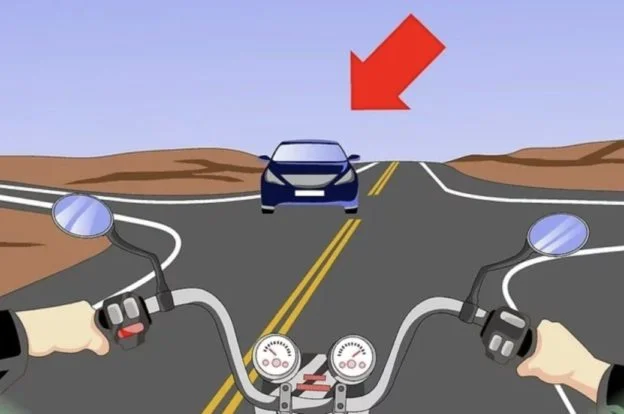
The image alongside depicts a near-collision in which a driver made a sudden and unexpected left turn across the path of a motorcycle that was being tested by Dr. Lloyd. Appropriate braking operation by the rider and braking performance by the motorcycle is required to avoid collision.
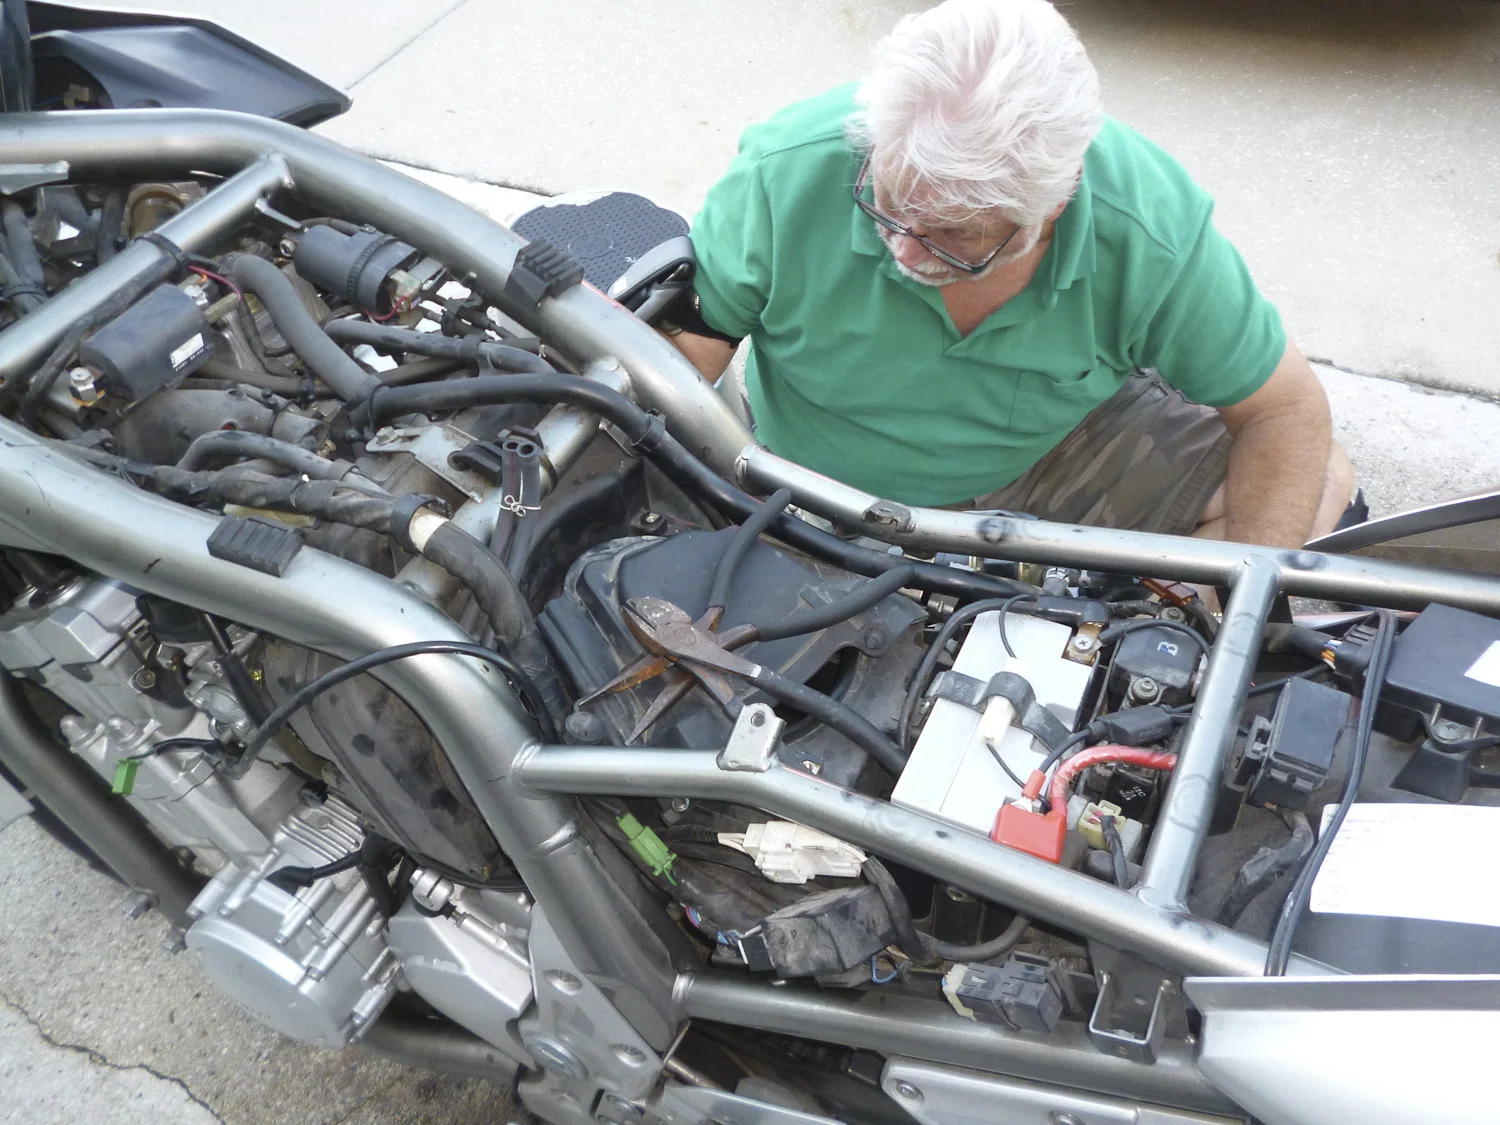
Motorcycle accident analysis often requires a teardown and careful inspection of the bike to investigate for possible contributing factors. Dr. Lloyd has decades of experience with motorcycle mechanics. A thorough evaluation includes inspection of tires, brakes, suspension setup, electrical components as well as any aftermarket parts. Inspections are best performed at Dr. Lloyd’s laboratory, but can also be conducted in the field.
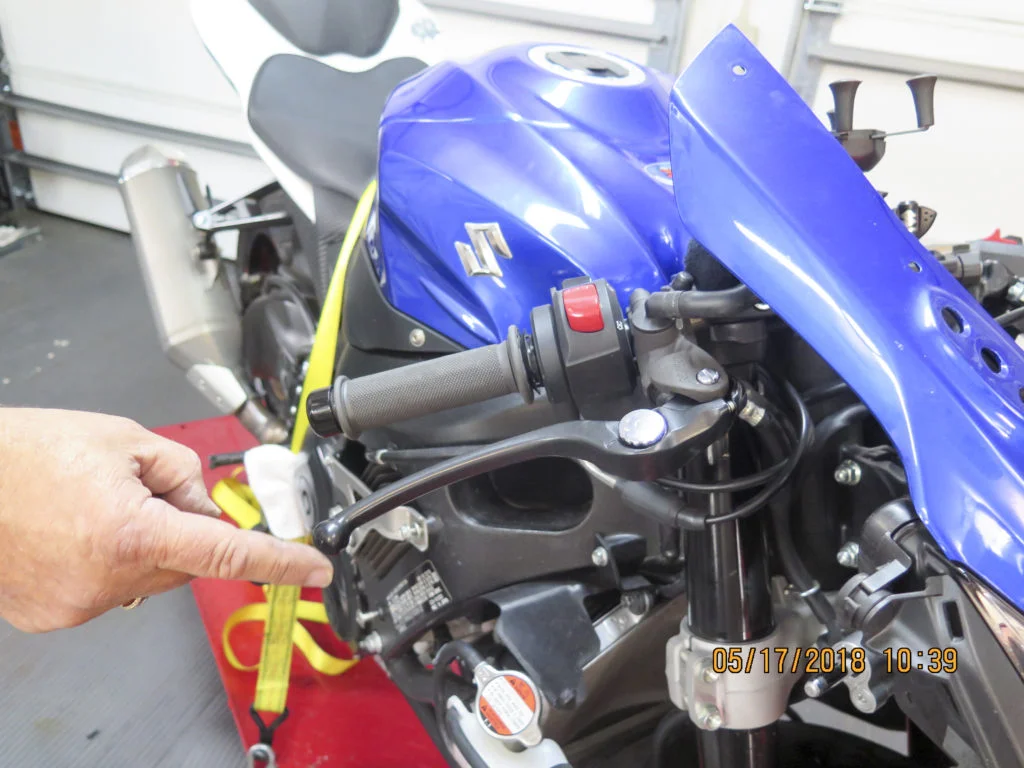
The following image is from an inspection of the front brake system on a Suzuki GSXR, which was the subject of a manufacturer recall
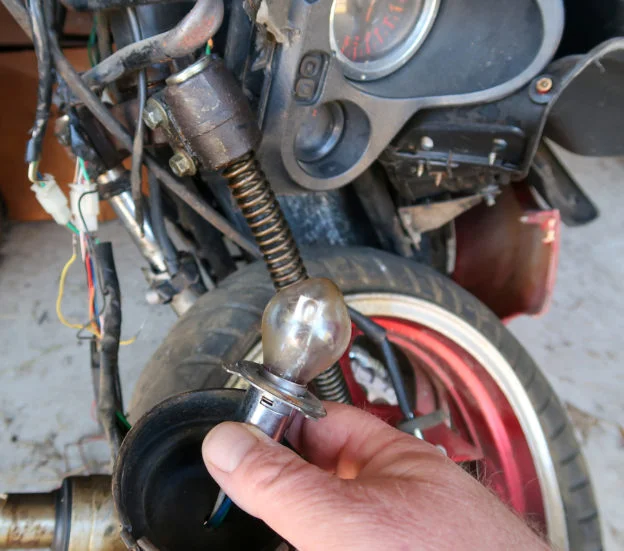
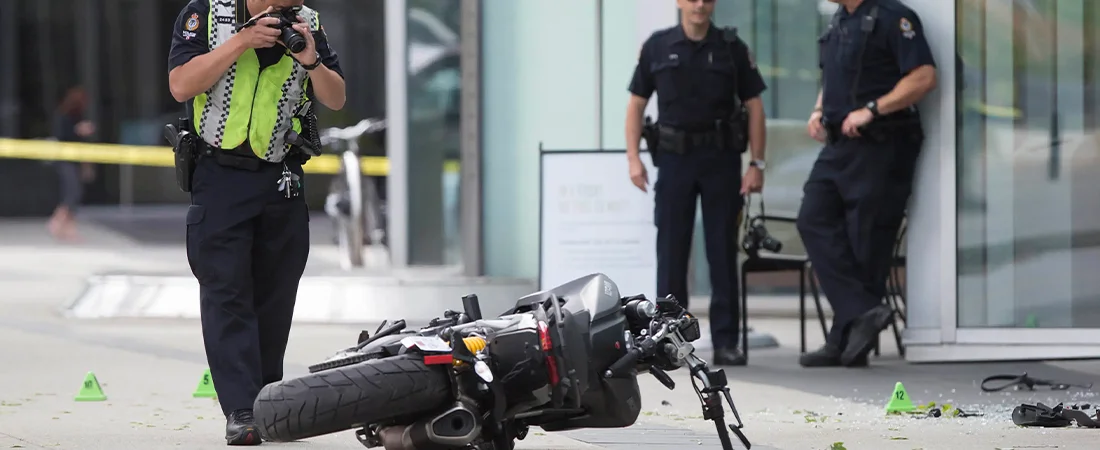
In a nighttime collision involving a scooter, it was claimed by the driver of a left turning vehicle that the scooter headlights were not operational. A thorough inspection of the electrical system was required by a motorcycle inspection expert:
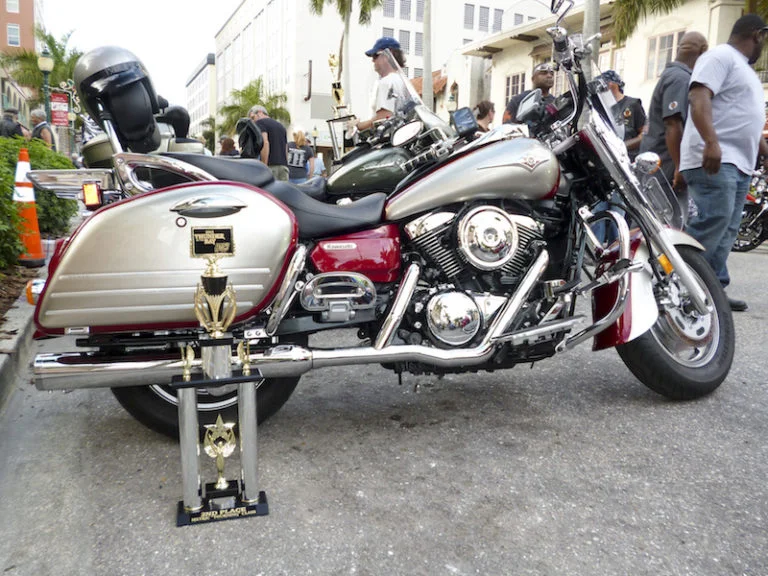
Dr. Lloyd has also participated in motorcycle build-off competitions and won a trophy for his custom Kawasaki Vulcan motorcycle.
In 2016 there were more than 8.4 million motorcycles registered in the United States, representing 3.2% of all US vehicles. California, Florida and Texas were the leading States in terms of the motorcycle popularity; collectively representing 22% of all US registered motorcycles. According to the U.S. National Highway Traffic Safety Administration (NHTSA), when compared per vehicle mile traveled with automobiles, due to their vulnerability, motorcyclists’ risk of a fatal crash is 30-35 times greater than that of a car occupant.
Number One Cause of Motorcycle Crashes
Seventy-five percent of accidents were found to involve a motorcycle and a passenger vehicle, while the remaining 25% of accidents were single motorcycle accidents.
The number one cause of motorcycle crashes is a motorist making a left turn across motorcycle path. With reference to the Hurt report in the United States and the MAIDS in-depth investigation of motorcycle accidents in Europe, approximately two-thirds of all motorcycle crashes involving other vehicles are caused due to violation of the motorcycle rider’s right of way by the failure of motorists to detect and recognize motorcycles on the road.
While the motorcycle rider has right of way, they are also more vulnerable to injury. Motorcyclists must therefore be extra-vigilant, especially when approaching intersections. Appropriate riding gear, including a DOT certified helmet, motorcycle jacket and riding boots offer the motorcyclist the best protection. Findings of the Hurt study indicate that severity of motorcyclist injury increases with speed, alcohol consumption, motorcycle size and speed.
Motorcyclist Conspicuity
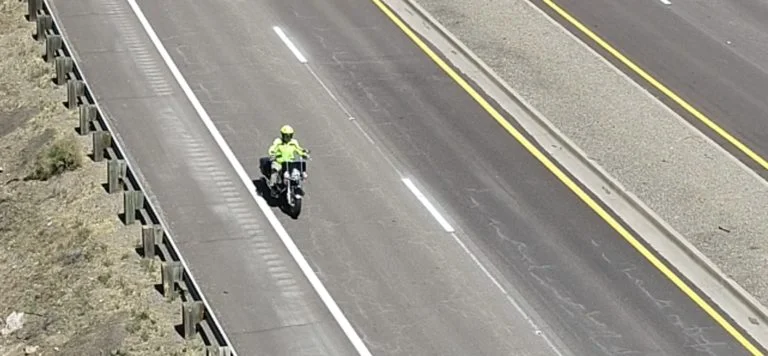
Conspicuity is one of the key factors in motorcycle road crashes around the world. The inability and difficulty of other road users in detecting motorcycles either at day or at night has contributed to conspicuity related motorcycle crashes. Additional lights and brightly colored riding gear can help to improve motorcyclists conspicuity to other roadway users. The following image depicts this author wearing a hi-visibility motorcycle jacket and helmet to enhance conspicuity.
An expert on motorcycle crashes can reconstruct these accidents for the courts, insurance companies, and legal teams. Here is the process of how a motorcycle crash expert conducts accident reconstruction.
The Process of Motorcycle Accident Reconstruction
Motorcycle crash experts start from a systematic perspective in reconstructing any accident. To that end, multiple phases of investigation occur: evidence collection, analysis of impact forces, and human factors. Below are the basics of how a crash assessment is reconstructed by an authority such as Dr. John Lloyd:
Scene Investigation and Data Collection
The first step of any reconstruction should be an extensive investigation of the crash site. A motorcycle crash expert would collect crucial data, including:
Skid marks and tire tracks
Road condition”s depression, dry, gravel, and uneven
Vehicle damage and final resting position
Witness statements and video footage, if any
Weather and light during the time of the crash
3D mapping of the scene using a professional drone
Analyzing Motorcycle Dynamics and Impact Forces
The motorcycle helmet expert studies various parameters. Dr. Lloyd conducts a biomechanical reconstruction as a basis for analyzing the rider’s pre and post-collision movements. The effects of helmet protection and the pattern of injuries give an impression of what forces were in play.
Human Factors and Rider Behavior Analysis
Human factors are very important in accident reconstruction. Factors studied by Dr. Lloyd include:
Perception and reaction time of the rider
Visibility and knowledge of the road
Hazards such as fatigue, distractions, or impairment
Evasive maneuvers attempted by the rider
An expert in motorcycle accidents can determine whether rider error, vehicle defects, or environmental factors contributed to the causation of an accident.
Computer Simulations and Expert Testimony
Advanced, 3D physics-based computer simulation allows experts like Dr. Lloyd to reproduce motorcycle accidents with high accuracy. Such reconstructions are not only informative to the legal team and adjusters but are also very useful at trial to illustrate the collision sequence.
In doing so, Dr. Lloyd works as an expert witness, presenting these conclusions in court and supplementing them with scientific explanations for court-related purposes.
FAQs – Motorcycle Crash Expert
Can accident reconstruction determine fault in a motorcycle crash?
Yes, a motorcycle crash expert studies many aspects to determine liability, including vehicle speeds, road conditions, and rider behaviors.
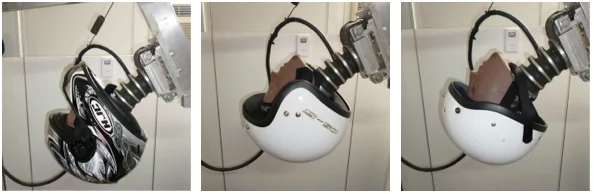
Why is helmet analysis important in accident reconstruction?
Helmets save lives, and experts like Dr. John Lloyd analyze the damage to a helmet to determine the levels of head impact forces and possible injuries to the brain.
Final Thoughts!
Accident reconstruction uses a detailed process and requires various specialization in biomechanics, human factors, and vehicle dynamics. Dr. John Lloyd, a well-known motorcycle crash expert, uses a scientific approach to establish causation in various motorcycle accidents. His expertise helps legal teams and insurance companies better understand these often complicated cases.
Motorcycle collision analysis is a highly specialized discipline in which Dr. Lloyd is eminently qualified as a motorcycle accident expert. In addition to holding a PhD in Ergonomics (Human Factors), with a specialization in Biomechanics, John has more that 20 years and 200,000 miles of experience riding motorcycles. Dr. Lloyd has completed numerous advanced programs, including Motorcycle Safety Foundation (MSF), Experienced Rider Course and Total Rider Tech Advanced training.
Motorcycle Helmets and Brain Injury
To consider whether a motorcycle helmet might reduce the risk of brain trauma in a motorcycle accident it is first important to understand the two primary mechanisms associated with traumatic brain injury – impact loading and impulse loading.
Impact loading involves a direct blow transmitted primarily through the center of mass of the head, resulting in extracranial focal injuries, such as contusions, lacerations and external hematomas, as well as skull fractures. Shock waves from blunt force trauma may also cause underlying focal brain injuries, such as cerebral contusions, subarachnoid hematomas and intracerebral hemorrhages. Whereas, impulse or inertial loading caused by sudden movement of the brain relative to the skull, produces cerebral concussion. Inertial loading at the surface of the brain can cause subdural hemorrhage due to bridging vein rupture, whereas if affecting the neural structures deeper within the brain can produce diffuse axonal injury (DAI).
Holbourn was the first to cite angular / rotational acceleration as an important mechanism in brain injury. Gennarelli, Thibault, and colleagues, in a series of studies using live primates and physical models investigated the role of rotational acceleration in brain injury. They concluded that angular acceleration contributes more than linear acceleration to brain injuries, including concussion, axonal injury, and subdural hematoma.
Motorcycle Helmet Testing
Traditional testing of motorcycle helmets focuses on reducing the effect of linear impact forces by dropping them from a given height onto an anvil and measuring the resultant peak linear acceleration. According to the Federal Motor Vehicle Safety Standard (FMVSS) 218, commonly known as the DOT helmet standard, the test involves dropping a motorcycle helmet onto a flat steel and hemispherical anvil at an impact velocity of 6.0 m/s (13.4mph). In general, if peak linear acceleration is less than 400g, the helmet is considered acceptable. Current motorcycle helmet testing standards do not incorporate measures of angular acceleration and therefore do not address whether any helmets can provide adequate protection against catastrophic brain injuries, such as concussion, axonal injury and subdural hematoma.
In 1995, the European Commission Directorate General for Energy and Transport initiated a Cooperative Scientific and Technical Research (COST) program to investigate Motorcycle Safety Helmets. Several agencies from Finland, the United Kingdom, France and Germany participated in this study, which compiled and analyzed data from 4,700 motorcycle fatalities in Europe, each year. The COST report documents that 75% of all fatal motorcycle accidents involve head injury. Linear forces were present in only 31% of fatal head injuries, while rotational forces were found to be the primary cause in over 60% of cases. Within the scope of this study experiments were performed using drop tests with accelerometers to measure linear and rotational accelerations of the brain and skull mass associated with different types of impacts. These tests confirmed rotational acceleration to be a primary cause of brain injury in helmeted motorcycle accidents.
Rotational forces acting on the brain are the underlying cause of traumatic brain injuries.
Motorcycle helmets, including those certified under DOT and SNELL standards are designed to mitigate forces associated with linear acceleration.
Motorcycle helmets are not currently certified under either DOT or SNELL standard against their ability to protect against the angular / rotational forces.
Epidemiologic evidence from the COST-327 report indicates that motorcycle helmets do not provide adequate protection against closed head and brain injuries
Human Factors of Motorcycle Accidents
Human factors in vehicle collisions include all factors related to drivers and other road users that may contribute to a collision. Examples include driver behavior, visual and auditory acuity, decision-making ability, and reaction speed. A 1985 report based on British and American crash data found driver error, intoxication and other human factors contribute wholly or partly to about 93% of crashes.
Motorcycle Inspection
Motorcycle accident analysis often requires involves a teardown and careful inspection of the machine to investigate for possible contributing factors. Our engineers have a combined 70 years experience with motorcycle mechanics.
A thorough evaluation includes inspection of tires, brakes, suspension setup, electrical components as well as any aftermarket parts.
Dr. John Lloyd has over 30 years of forensic consulting experience as a motorcycle accident expert including motorcycle handling and operation as well as maintenance, repair and motorcycle inspection.
Motorcycles are a luxury in the developed world, where they are used mostly for recreation. Whereas in developing countries, motorcycles are required for utilitarian purposes due to lower prices and greater fuel economy. It is estimated that in 2016 there will be more than 134 million motorcycles worldwide, 60-80% of which are in the Asia Pacific and Southern and Eastern Asia regions. In 2011 there were more than 8.2 million registered motorcycles in the United States, representing 3% of all US registered vehicles, with California, Florida and Texas leading the number of motorcycles per state.
In the United States motorcyclists travelled 18.5 billion miles in 2011, which represents only 0.6% of total vehicle miles travelled, yet motorcyclists accounted for 14% (4,612) of traffic fatalities and 4% (81,000) of all occupant injuries 2. According to the U.S. National Highway Traffic Safety Administration (NHTSA), when compared with automobiles, per vehicle mile traveled, motorcyclists’ risk of a fatal crash is 35 times greater than that of a car occupant
In a motorcycle accident, the motorcycle and rider typically become independent, each following their own path to final rest. Consequently, the biomechanical analysis of a motorcycle accident is complex. A biomechanical model to assess rider kinematics associated with motorcycle accidents is presented, which may be important to forensic scientists involved in the analysis of such events. This model can also be applied to other activities, including cycling, equestrian sports, skiing, skating, running, etc.
It is first important to understand the mechanisms by which a rider may be ejected from their motorcycle and how drag factors affect the motorcycle and rider independently. Next we determine rider trajectory, taking into consideration rider anthropometry and posture, results from which are used to derive impact velocity as a function of linear and angular components. A case study is presented, demonstrating how the presented model can be applied to a collision involving a single motorcycle.
The following is a case study in which biomechanics expert, Dr. John Lloyd, evaluated the risk of concussion and brain injury associated with headrest impact in rear end crashes.
Headrest Impact Test Apparatus:
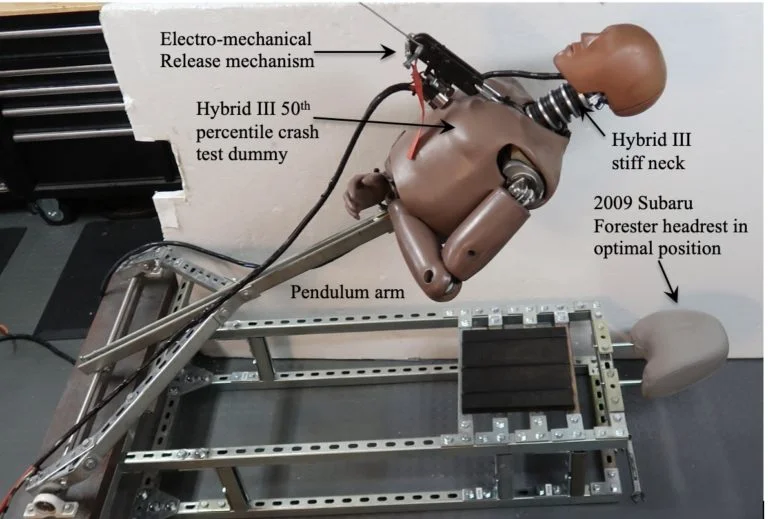
In accordance with prior published test methods[1],[2],[3], a test apparatus was constructed to evaluate the biomechanical protection afforded by an exemplar automobile headrest against head and brain injuries during occipital head impacts in a simulated rear-end motor vehicle collision.
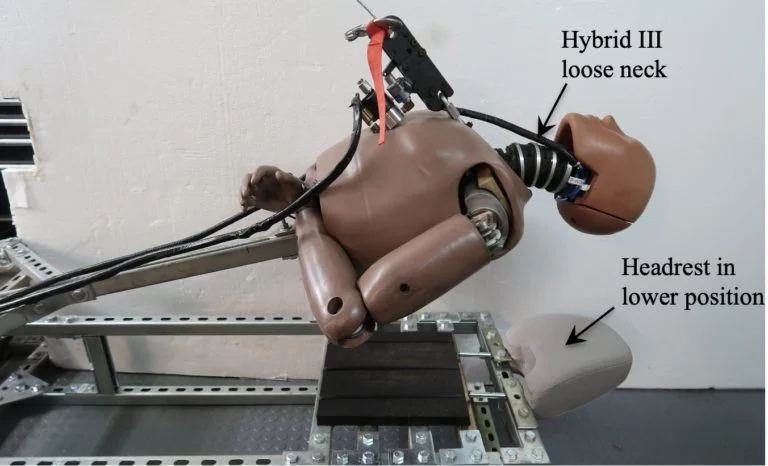
The apparatus involves a pendulum arm, attached by bearing housings to a weighted base. The upper body, including neck and head of a 50th percentile Hybrid III crash test dummy was mounted to the pendulum arm. Data acquisition was initiated by triggering an electromechanical release mechanism, allowing the mannequin to fall, under acceleration due to gravity, until the crash test dummy impacted the headrest and backrest (Figure 1).
Figure 1: Test apparatus
The fundamental elements and principles of this testing have been utilized in other laboratories. By utilizing a Hybrid III neck, the head impact tests are more realistic, causing head rotation at the axis between the head and neck, which produces measures of head and brain angular kinematics. The methods presented herein are based upon standardized test methodologies and published research.
Instrumentation
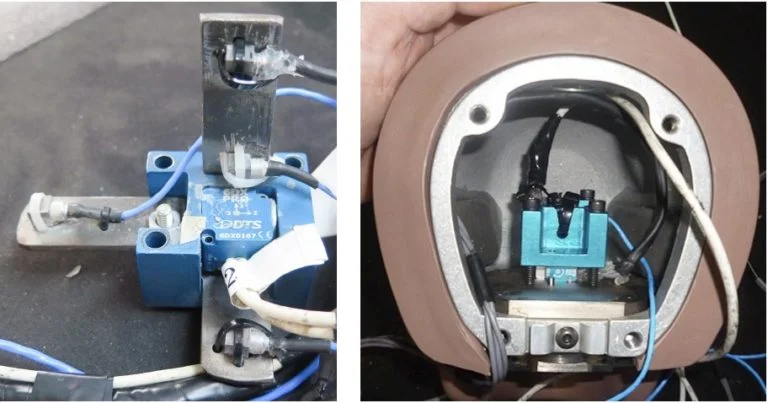
Four PCB Piezotronics tri-axial accelerometers (model # 356A01) were mounted in an X,Y,Z array at the center of mass of the Hybrid III headform, along with a tri-axial angular rate sensor produced by Diversified Technical Systems (composite Figure 2).
Figure 2: Sensor installation in Hybrid III headform
Sensor Calibration:
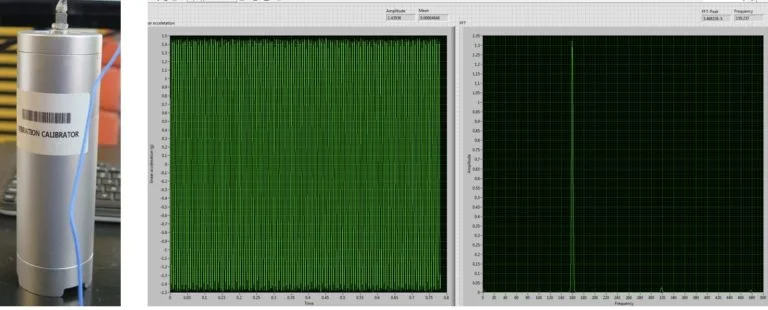
All sensors were calibrated by the manufacturer. Verification of calibration of the linear accelerometers was performed prior to testing using a calibration shaker. Results indicate that the sensors were operating in the specified frequency range and output (Figure 3).
Figure 3: Pre-test verification of linear accelerometer sensors
For the angular rate sensor, a simple validation method was devised in which the sensor was affixed to a digital goniometer that was rotated through a 90-degree angle. Using LabVIEW software, the integral of angular rate was computed, reflecting concurrence with the digital goniometer for all three planes of motion (Figure 4).
Figure 4: Pre-test validation of angular rate sensor calibration
Headrest Impact Testing:
The mannequin head was raised from the headrest in 2-inch increments from 2 inches to 30 inches, generating head impact speeds from 1 to 25 miles per hour. Two headrest positions were evaluated, along with two different Hybrid III necks representative of a stiff and relaxed neck (Figure 5), for a total of sixty tests.
Figure 5: Test apparatus with Hybrid III loose neck and headrest in lower position
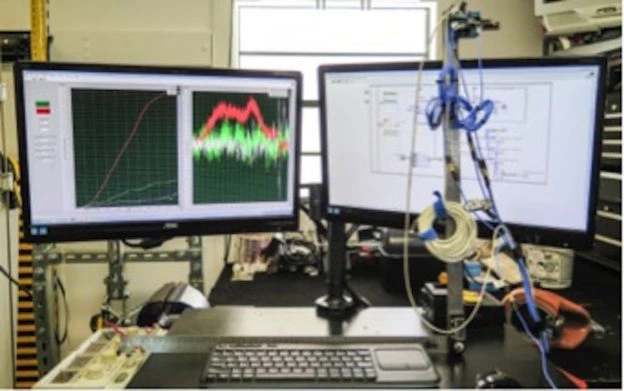
Data Acquisition and Analysis:
Data from the analog sensors were acquired in accordance with SAE J211 [4], using a National Instruments compact DAQ data acquisition system and LabVIEW software (National Instruments, Austin, TX). The raw data was then filtered in MATLAB (The MathWorks, Natick, MA) using a phaseless eighth-order Butterworth filter with cutoff frequencies of 1650 Hz and 300Hz for the linear accelerometers and angular rate sensors, respectively.
Angular acceleration values for sagittal, coronal and axial planes were computed from the angular velocity data using the 5-point central difference by least squares method (Equation 1):
Equation 1: Five-point central difference by least squares method
Angular acceleration vales were also derived from the array of linear accelerometers, by the mathematical method documented by Padgaonkar et al [5].
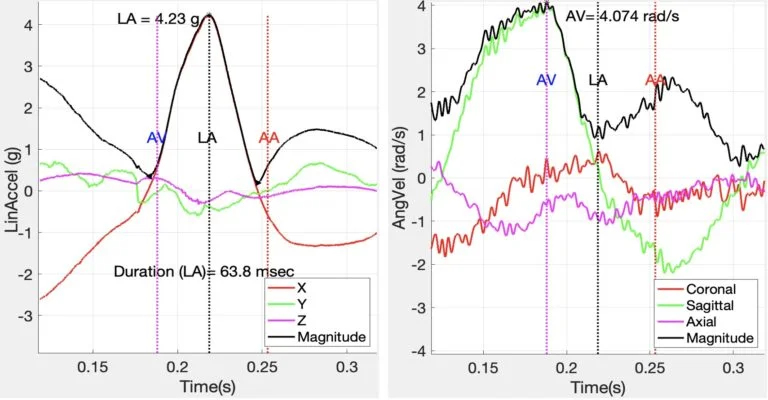
Linear velocity was calculated by integrating linear acceleration. Mathematical methods were performed using Matlab to compute characteristic values from variables of interest. Figure 6, below illustrates peak linear acceleration and angular velocity associated with a 6.8 mph occipital head impact against a headrest.
Figure 6: Linear acceleration and angular velocity associated with headrest impact
It is noted that the major component of linear acceleration was in the X-axis (anterior-posterior), while the major component of angular velocity was in the sagittal plane, as expected.
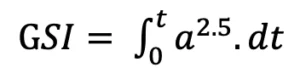
Linear acceleration values were used to calculate Maximum Pressure (Equation 2), Gadd Severity Index (GSI) (Equation 3), and Head Injury Criterion (HIC15) (Equation 4).
Equation 2: Maximum Pressure
Equation 3: Gadd Severity Index
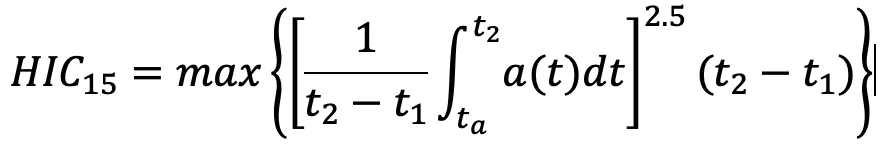
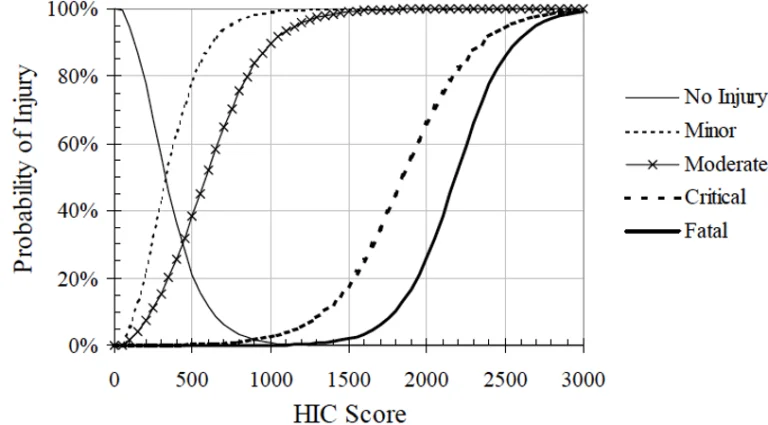
The Head Injury Criterion (HIC) is an empirical measure of impact severity describing the relationship between the linear acceleration magnitude, duration of impact and the risk of head trauma (Equation 4).
Equation 4: Head Injury Criterion
where a is resultant head acceleration, t2-t1 < 15 msec
With reference to the Figure 7, below, the HIC value is used to predict the risk of head trauma: Minor –skull trauma without loss of consciousness; nose fracture; superficial injuries Moderate – skull trauma with or without dislocated skull fracture and brief loss of consciousness. Fracture of facial bones without dislocation; deep wound(s) Critical – Cerebral contusion, loss of consciousness for more than 12 hours with intracranial hemorrhaging and other neurological signs; recovery uncertain.
Figure 7: Probability of specific head trauma level based on HIC value
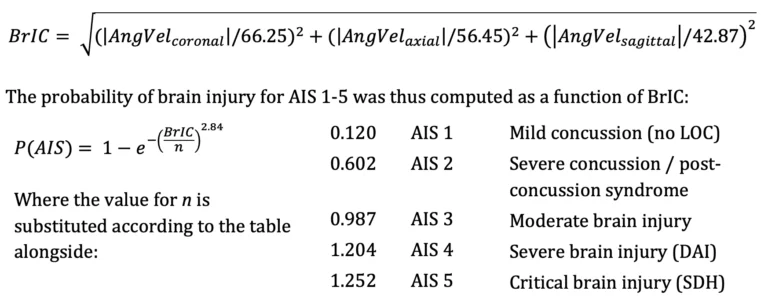
Peak angular velocity was determined as the maximum angular velocity related to peak linear acceleration impact time. Angular velocity values were used to derive Maximum Principal Strain (MPS) (Equation 5), Cumulative Strain Damage Measure (CSDM) (Equation 6), and Brain Rotational Injury Criterion (BrIC) (Equation 7).
Equation 5: Maximum Principal Strain
Equation 6: Cumulative Strain Damage Measure
An analysis method validated by Takhounts [6] establishes physical injury criteria for various types of traumatic brain injury and uses Anthropomorphic Test Device (ATD) data to establish a kinematically based brain injury criterion (BrIC) for use with ATD impact testing. This method was utilized to express risk of diffuse brain injury according to the revised AIS scale [7] in terms of peak angular head kinematics, where:
Equation 7: Brain Rotational Injury Criterion
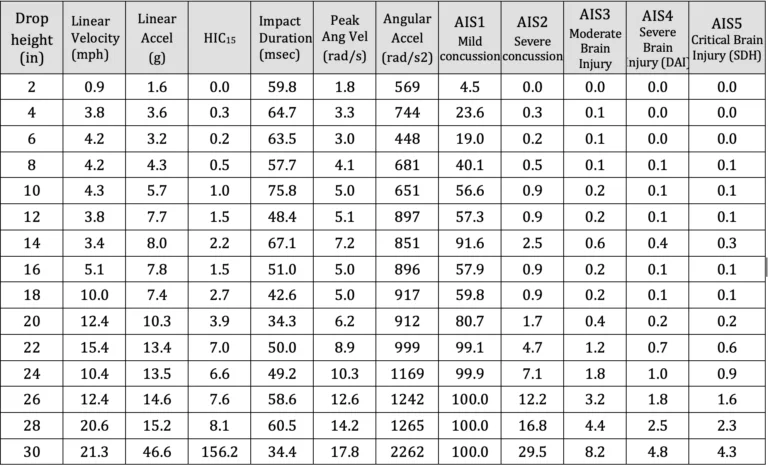
Headrest Impact Results:
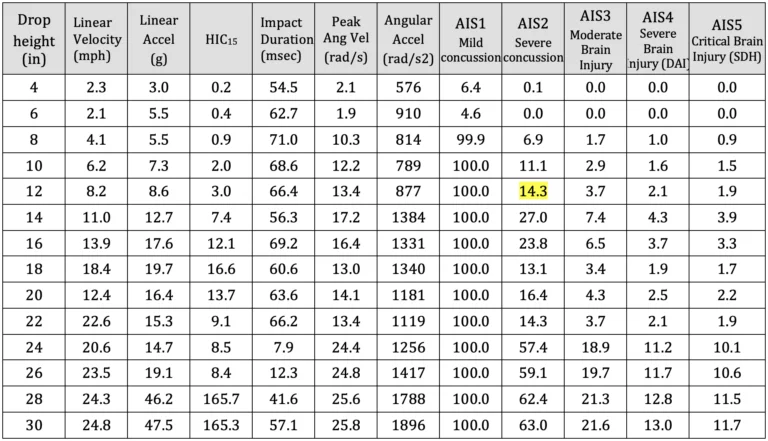
A summary of key results is presented in Table a-d, below. The driver was aware of the pending impact, as he depressed the accelerator in an attempt to avoid the collision in the moments prior to the crash. In rear end collision tests involving human subjects, volunteers instinctively tensed their neck muscles as a protective response. Given that the driver anticipated the crash his neck muscles were likewise expectedly tense as an instinctive protective response. Therefore, the results most consistent with the subject case are presented in Tables a and b. Rows highlighted in green are consistent with change in velocity experienced by the driver during the subject crash.
Table a: Summary of test results – Neck – Stiff; Headrest – lower position
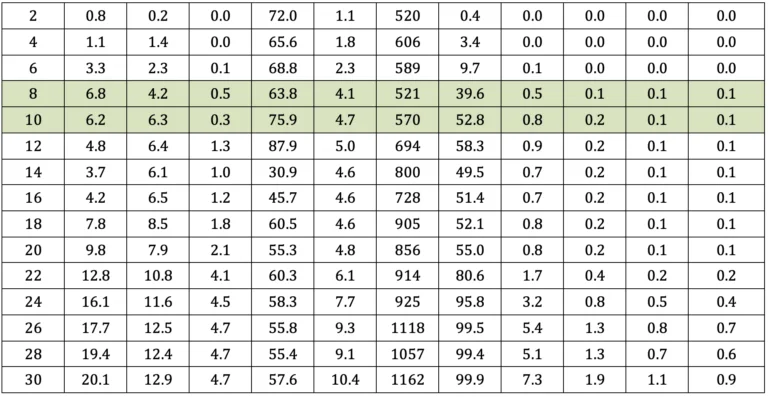
Table b: Summary of test results – Neck – Stiff; Headrest – upper positio
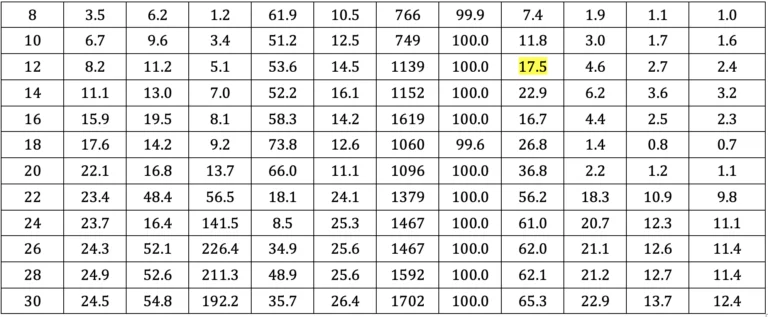
Table c: Summary of test results – Neck – Loose; Headrest – lower position
Table d: Summary of test results – Neck – Loose; Headrest – upper position
Skull Fracture
With reference to Ono 8, none of the impact tests approached the occipital skull fracture threshold of 140 g for impacts lasting longer than 7 milliseconds. Therefore, vehicle headrests provide excellent protection against acute skull fractures at impact speeds below 25 mph.
Traumatic Head Injury
With reference to Figure 7 and Tables a-d, maximum recorded HIC values were consistent with a 5 percent or less risk of moderate traumatic head injury. Whereas, the HIC value computed at impact speeds similar to the crash was only 3.4, at which the risk of minor or moderate traumatic head injury is negligible.
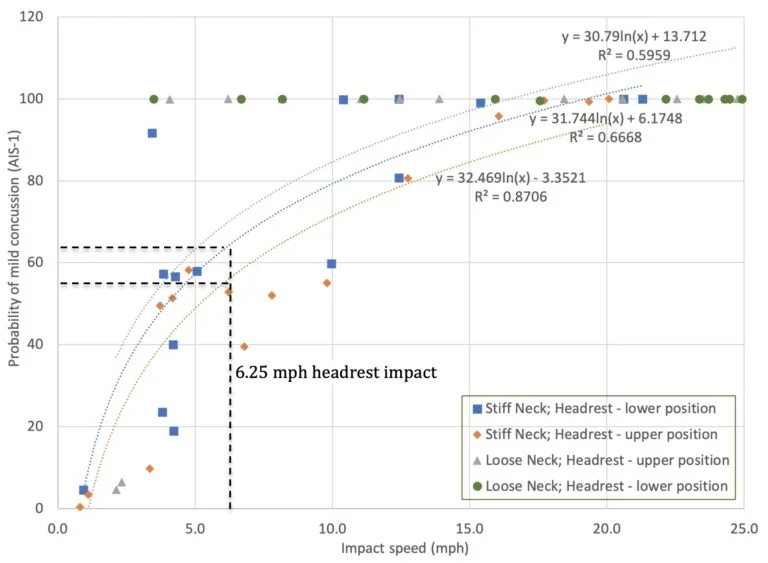
Mild Concussion
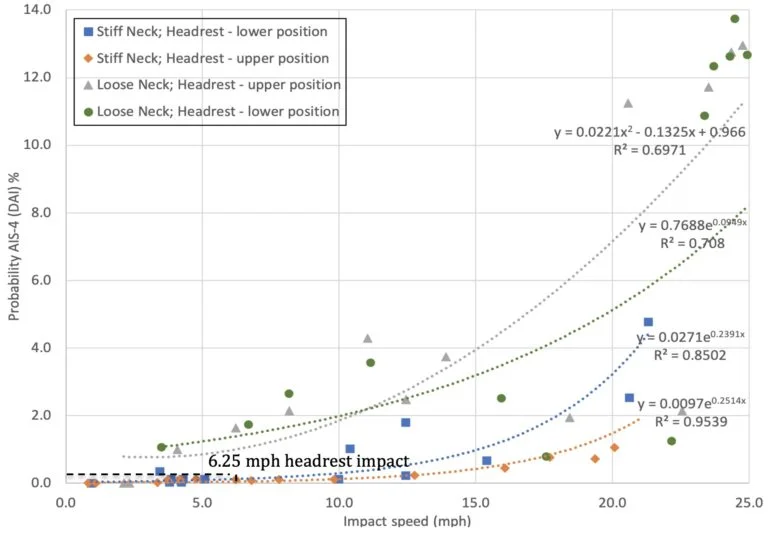
With reference to Figure 8 below, the risk of an occupant sustaining a mild concussion in a rear-end collision producing a change in velocity of 6.25 mph (range 5.4 to 7.2 mph) can be determined based on the following calculation: Risk AIS-1 = 31.744*ln(x) + 6.1748 (R2=0.67). The risk of and AIS-1 mild concussion, without post-concussion syndrome, in such an impact is 64.3% (range 59.7 to 68.8%).
Figure 8: Risk of mild concussion (AIS-1) associated with headrest impact
Severe Concussion
With reference to Figure 9, below, the risk of an occupant sustaining a severe concussion in a rear-end collision producing a change in velocity of 6.25 mph (range 5.4 to 7.2 mph) can be determined based on the following calculation: Risk AIS-2 = 0.198e0.234x (R2=0.85). The risk of severe concussion in such an impact is 0.85% (range 0.70 to 1.07%).
Figure 9: Risk of severe concussion (AIS-2) associated with headrest impact
Traumatic Axonal Injury:
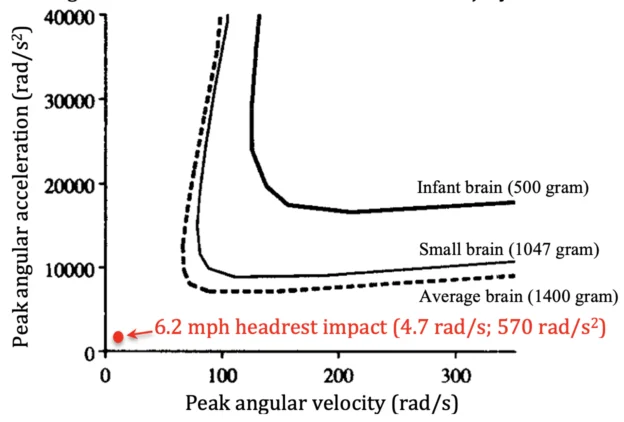
Figure 10, below, is adapted from Margulies et al. 20 in which thresholds for axonal injury were developed and published based on mathematical modeling, animal testing and physical experiments. Results from occipital head impact against an exemplar headrest at a speed of 6.2 miles per hour are represented, indicating that rotational head and brain kinematics associated with such impact are well below scientifically-accepted thresholds for traumatic axonal injury.
Figure 10: Scientific Thresholds for Axonal Injury
Figure 11, below was generated from data presented in Tables a through d, to present the risk of traumatic axonal injury associated with head impact against an headrest.
Figure 11: Risk of traumatic axonal injury (AIS-4) associated with headrest impact
Results show that the risk of an occupant sustaining traumatic axonal injury in a rear-end collision producing a change in velocity of 6.25 mph (range 5.4 to 7.2 mph) can be determined based on the following calculation: Risk AIS-4 = 0.0271e0.2391x (R2=0.85). The risk of traumatic axonal injury in an impact of the magnitude experienced by the driver is 0.12% (range 0.10 to 0.15%).
Conclusions
Biomechanical testing of head and brain injury risk associated with occipital head impact against a headrest, in accordance with published methods, shows a significant risk (59.7 to 68.8%) of AIS-1 mild concussion, without post-concussion syndrome, in a 6.2 mph rear-end collision. However, the risk of an AIS-2 severe concussion in such an impact decreases to 0.70 to 1.07%, and the risk of traumatic axonal injury is only 0.10 to 0.15%. Moreover, the mechanical traumatic axonal injury is not consistent with a sagittal plane impact.
References
[1] Caccese V, Lloyd J, Ferguson J (2014) An Impact Test Apparatus for Protective Head Wear Testing Using a Hybrid III Head-Neck Assembly. Experimental Techniques.
[2] Lloyd J & Conidi F. (2015). Brain Injury in Sports. Journal of Neurosurgery. October.
[3] Lloyd J. (2017). Biomechanical Evaluation of Motorcycle Helmets: Protection Against Head and Brain Injuries.Journal of Forensic Biomechanics.
[4] SAE (2014) J211/1. Instrumentation for Impact Test – Part 1 – Electronic Instrumentation. Society of Automotive Engineers International, Surface Vehicle Recommended Practice, Warrendale, PA.
[5] Padgaonkar AJ, Krieger KW and King AI. Measurement of Angular Acceleration of a Rigid Body using Linear Accelerometers. J Applied Mechanics. Sept 1975.
[6] Takhounts EG, Craig MJ, Moorhouse K, McFadden J (2013) Development of Brain Injury Criteria (BrIC). Stapp Car Crash Journal 57: 243-266.
[7] Abbreviated Injury Scale (2008) Association for the Advancement of Automotive Medicine, Des Plaines, IL.

 Dr. Lloyd has completed numerous advanced programs, including Motorcycle Safety Foundation (MSF), Experienced Rider Course and Total Rider Tech Advanced training.