John Lloyd, PhD, CPE, ACTAR, D-IBFES
CV – Curriculum Vitae – Resume
Board Certified Expert Witness
Biomechanics, Human Factors and Accident Reconstruction
Specializing in Motorcycle Crashes and Helmet Protection
Mailing address: 32824 Michigan Avenue, San Antonio, Florida 33576
Telephone: (813) 624-8986
Email: John@DrBiomechanics.com
(Curriculum Vitae – Resume last updated February 17th, 2025)
Expertise
- Motorcycle Crashes
- Motorcycle Riding
- Motorcycle Helmets
- Biomechanics of Head and Brain Injury
- Human Factors
- Automobile Accidents
- Truck Accidents
- Concussion
- Football Helmets
Education and Training
- Ph.D. Ergonomics, Loughborough University, Leicestershire, England, 2002
- B.Sc. (Honors) Ergonomics, Loughborough University of Technology, England, 1992
- D.P.S. Loughborough University of Technology, Leicestershire, England, 1991
Certification and Registration
- CPE (#725) Certificant, Board of Certification in Professional Ergonomics, 1995
- M.Erg.S. Member of The Ergonomics Society Professional Register, 1996
- CBIS (#6667) Certified Brain Injury Specialist (Cognitive Rehabilitation), Academy of Certified Brain Injury Specialists, 2010-13
- ACTAR (#4658) Accredited Traffic Accident Reconstructionist
- D-IBFES. Diplomat, International Board of Forensic Engineering Sciences
Present Appointments
- President
Lloyd Industries, Inc. San Antonio, FL. - Research Director
BRAINS, Inc., San Antonio, FL.
Past Employment
2002-2022 Courtesy Assistant Professor
Department of Chemical and Biomedical Engineering, College of Engineering, University of South Florida, Tampa, FL
09/11-02/16 Director of Traumatic Brain Injury Laboratory / Program Specialist
James A Haley Veterans Hospital, Tampa, FL
08/09-09/11 Associate Director
Veterans Administration, Health Services Research and Development (HSR&D) / Rehabilitation Research and Development (RR&D) Research Center of Excellence, Tampa, FL
10/99-08/09 Director of Research Laboratories
Patient Safety Center of Inquiry, James A. Haley Veterans Hospital, Tampa, FL
05/98-05/00 Director of Information Systems
UTEK Corporation, Plant City, FL
06/96-10/99 Acting Director
Center for Product Ergonomics, University of South Florida, Tampa, FL
01/96-05/96 Ergonomics Laboratory Manager / Research Ergonomist
Center for Product Ergonomics, University of South Florida, Tampa, FL
07/93-01/96 Principal Ergonomist
The Ergonomics Institute, Hauppauge, NY
07/92-07/93 Ergonomics /Biomechanics Consultant
Biomechanics Corporation of America, Melville, NY
07/90-07/91 Research Ergonomist
Liberty Mutual Research Center, Hopkinton, MA
12/88-07/90 Human Reliability Consultant
R M Consultants Ltd., Warrington, Cheshire, England
Professional Memberships
- American Academy of Neurology (AAN)- Research Scientist
- American Academy of Forensic Sciences (AAFS)- Fellow
- American Biomechanics Society (ASB)
- American Society Mechanical Engineering (ASME)
- Academy of Certified Brain Injury Specialists (ACBIS) (former)
- ASTM Committee F08 on Sports Equipment, Playing Surfaces and Facilities
- Board of Certification in Professional Ergonomics #725 (BCPE)
- Human Factors and Ergonomics Society (HFES)
- National Neurotrauma Society (#10662)
- International Brain Injury Association (IBIA)
- The Ergonomics Society (former)
- Sigma Xi Scientific Research Honor Society
- Airborne Public Safety Association (APSA)
- National Association of Traffic Accident Reconstructionists and Investigators (NATARI)
- National Association of Professional Accident Reconstruction Specialists (NAPARS)
- Society of Accident Reconstructionists (SOAR)
- Accreditation Commission for Traffic Accident Reconstructionists (ACTAR)
- State Rider Safety Association (SRSA)
- International Board of Forensic Engineering Sciences (IBFES)
Awards and Honors
- Article of the Year Award (1998)
- Certificate of Excellence awarded by VHA Patient Safety Research Center (2002)
- Author of Top 10 cited paper (2006-2008) in International Journal of Nursing Studies
Professional Training Courses
- 1990 Human Factors in Occupational Health & Safety, Harvard School of Public Health
- 1992 Ergonomics and Design, Loughborough University of Technology
- 1999 Ergonomics Workshop: 3D Static Strength Prediction, University of Michigan
- 2004 Vicon BodyBuilder & Polygon training workshop, Vicon Motion Systems, Inc.
- 2009 LabView Introductory and Advanced workshops, National Instruments
- 2011 Successful Measurement of Dynamic Force, Pressure, and Acceleration, presented by PCB Piezotronics
- 2011 Using Mimics to create 3D Finite Element models from Radiographic CT and MR images, presented by Materialize
- 2011 Matlab fundamentals, presented by The Mathworks
- 2011 Cognitive Rehabilitation workshop, hosted by North American Brain Injury Society
- 2012 Brain Computer Interface workshop, hosted by Florida Hospital, Orlando
- 2013 Pediatric Pathology for Forensic Pathologists, hosted by AAFS, Washington DC
- 2014 EDC Accident Reconstruction Course – HVE EDCRASH / EDSMAC, Miami, FL (40 Hr.)
- 2015 Reconstruction and Analysis of Motorcycle Crashes – SAE International (Society of Automotive Engineering), Detroit, MI (8 hr.)
- 2015 Investigation of Motorcycle Crashes – Institute of Police Training and Management, Jacksonville, FL (40 hr.)
- 2015 Automating Hardware Control and Advanced Programming Techniques in MATLAB. The MathWorks. Tampa, FL.
- 2015 Data Acquisition using Matlab. The MathWorks. Tampa, FL.
- 2018 Traffic Crash Analysis using Virtual Crash – Forensic Training Group, Nashville, TN (32 hr.)
- 2018 Symposium on Traffic Safety – IPTM, Orlando, FL (32 hr.)
- 2018 Energy Methods and Damage Analysis in Traffic Crash Reconstruction – Institute of Police Training and Management, Jacksonville, FL. (40 hr.)
- 2018 Advanced Analysis of Driver Responses – Institute of Police Training and Management, Jacksonville, FL. (40 hr.)
- 2020 Crash Evaluation: Analyzing the Impaired Driver – Crash University (32 hr.)
- 2021 Ariel Photogrammetry for Crash and Crime Scenes Using Pix4D – Forensic Mapping Solutions (16 hr.)
- 2021 FAA Remote Pilot-in-Command Training (16 hr.)
- 2021 Virtual CRASH Live Training (24 hr.)
- 2022 Pix4Dmatic and Pix4Dsurvey essentials (24 hr.)
- 2023 Motorcycle Collision Reconstruction – LightPoint (32 hr.)
- 2023 Traffic Crash Reconstruction Refresher – Northwestern University (40 hr.)
- 2023 Recon 3D certification course – Ai2-3D (4 hr.)
- 2023 Cloud Compare: Zero to Hero – Ai2-3D (8 hr.)
- 2024 Response User Forum – Driver Research Institute (24 hr.)
Webinar Training Courses
- 2018 Traffic Collision Technology – Laser Technology, Inc.
- 2019 Drone Mapping: Ground and Aerial Measurements – Laser Technology, Inc.
- 2020 EinScan Pro 2X Plus
- 2020 Pix4Dmapper for Collision Reconstruction
- 2020 DTS – Principles of Dynamic Data Collection
- 2020 FARO Zone 3D: Advanced Animation Techniques
- 2020 FARO Zone 3D: Utilizing EDR Data in the FARO Zone Software
- 2020 FARO SCENE Software: Creating Courtroom Deliverables
- 2021 CRASH SAFETY SOLUTIONS: Factors that Influence Nighttime Recognition
- 2023 Pix4Dmatic and Pix4DSurvey Essentials
- 2023 State of EDR in the US: CDR Update (NAPARS)
- 2023 Aerial Photogrammetry in Crash Reconstruction (NAPARS)
- 2023 Statistics for Crash Analysis (NAPARS)
- 2023 Monte Carlo Analysis in Crash Reconstruction (NAPARS)
- 2024 A Systematic Approach to Nighttime Crash Scene Investigations (NAPARS)
- 2024 Advances in Motorcycle Technology – Addressing New Vehicle Safety Features within Rider Training – Advanced Rider Assistance Systems (SMSA)
Editorial / Reviewer Appointments
- Occupational Health and Safety magazine, Stevens Publishing, Waco, TX
- Workplace Ergonomics, Stevens Publishing, Waco, TX
- Columnist for Ergonomics Intelligence Report, James Publishing, Santa Ana, CA
- Book reviewer for Ergonomics In Design, Human Factors and Ergonomics Society
- Journal of Rehabilitation Research and Development, Department of Veterans Affairs, Washington, DC
- Applied Ergonomics, Taylor and Francis, London
- Ergonomics, Taylor and Francis, London
- Department of Veterans Affairs HSR&D Scientific Merit Review Committee
- Department of Veterans Affairs RR&D Scientific Merit Review Committee
- Natural Sciences and Engineering Research Council of Canada (NSERC), grant reviewer for federal funding agency
- Applied Ergonomics Journal
- National Neurotrauma Society 2016 Symposium
- Journal of Safety
- New England Journal of Medicine
- Nebraska University Press
- Journal of Forensic Sciences
Grants and Funded Research
- ‘Biomechanical assessment of dynamic postural sway in healthy elderly.’ Role: Co-Investigator. Sponsored by Institute for Aging. Awarded $7,500, 1996.
- ‘Redesigning patient handling tasks and equipment to prevent nursing back injuries.’ Role: Co-Investigator. Sponsored by Department of Veterans Affairs RR&D. Awarded $305,000, 1997.
- ‘Effect of wrist exposures on median nerve conduction: Pilot study.’ Role: Co-Investigator. VA RR&D. Awarded $50,000, 1997.
- ‘Evaluation prototype: Exam room of the future.’ Role: Co-Investigator. Sponsored by BHM Medical, Inc. and Department of Veterans Affairs. Awarded $60,000, 1998.
- ‘Patient Safety Center of Inquiry.’ Role: Associate Director and Co-Investigator. Sponsored by VA HSR&D. Awarded $1,500,000, 1999.
- ‘VISN-Wide Deployment of a Back Injury Prevention Program for Nurses: Safe Patient Handling and Movement.’ Role: Co-Investigator. Sponsored by VA HSR&D. Awarded $2.4 million, 2001.
- Research Enhancement Award Program: ‘Safe Patient Mobility.’ Role: Associate Director and Co-Investigator. Sponsored by VA HSR&D. Awarded $1.1 million, 2001.
- ‘Development and Validation of Measurement System to Quantify Spinal Compression.’ Role: Co-Investigator.’ Sponsored by VISN8 Patient Safety Center of Inquiry. Awarded $5,000, 2001.
- Research Enhancement Award Program: ‘Technology to Prevent Adverse Events in Rehabilitation.’ Role: Associate Director and Co-Investigator. Sponsored by VA RR&D. Awarded $1.35 million, 2002.
- Enhancement of RR&D Research Laboratory Capabilities at the Tampa Veterans Administration Medical Center. Role: Principal Investigator. Sponsored by VA RR&D. Awarded $125,000, 2002.
- ‘Biomechanical assessment of wheelchair transfers toward upper extremity preservation in persons with SCI.’ Role: Co-Principal Investigator. VA RR&D. Awarded $50,000, 2002.
- ‘Patient Safety Center of Inquiry.’ Role: Associate Director and Co-Investigator. Sponsored by VA HSR&D. Awarded $2,000,000, 2003.
- ‘Development of an Instrumented Mannequin for Restraint and Control Training,’ Role: Principal Investigator. Sponsored by Department of Veterans Affairs, Office of Occupational Health and Safety. Awarded $75,000, 2003.
- ‘Validation of the Actiwatch as a Pain Treatment Outcome Measure.’ Role: Co-Investigator. Sponsored by VA RR&D. Awarded $200,325, 2005.
- ‘Folding Motorized Prone-Cart.’ Role: Co-Investigator. Sponsored by VA RR&D. Awarded $357,100, 2005.
- ‘Development of Force Gloves for Biomechanical Evaluation of Dynamic Patient Handling Tasks.’ Role: Co-Investigator. Sponsored by University of South Florida Patient Safety Foundation. Awarded $7,000, 2005.
- ‘Biomechanical Evaluation of Patient Transport Activities.’ Role: Co-Investigator. Sponsored by University of South Florida Interdisciplinary Grant Program, Dane Industries, Inc. Awarded $25,000, 2005.
- Tampa VA Shared Equipment Evaluation Program. VHA. Awarded $272,000, 2005.
- ‘Evaluation of Assistive Transfer Devices to Preserve UE Function in SCI.’ Role: Principal-Investigator. Sponsored by VA RR&D. Awarded $474,300, 2007.
- Center of Excellence: ‘Maximizing Rehabilitation Outcomes.’ Role: Associate Director. Sponsored by VA HSR&D / RR&D. Awarded $4,100,000, 2009.
- ‘Development of Headwear to Prevent Fall-Related Injuries in Elderly Persons.’ Role: Co-Investigator / Biomechanist. Sponsored by National Institutes of Health, Small Business Innovation Research. Awarded $1,000,000, July 2010.
- ‘Threats to Skin Integrity Associated with Ceiling Lift Sling Use in Persons with SCI.’ Role: Principal Investigator. Sponsored by Department of Veterans Affairs, Office of Occupational Health and Safety. $600,000, February 2011.
- ‘Biomechanical Evaluation of Techniques Associated with Prevention and Management of Disturbed Behavior – Phase 2’ VA Portland. Role: Principal Investigator. Awarded $60,000, February 2011.
- Equipment grant for Traumatic Brain Injury program. VA RR&D. Role: Principal Investigator. Awarded $239,000, April 2011
- ‘Biomechanical Evaluation of Techniques Associated with Prevention and Management of Disturbed Behavior – Phase 3’ VA Portland. Role: Principal Investigator. Awarded $68,700, December 2011.
- Development and Evaluation of a Sling-Less Lift System. VA RR&D. Role: Principal Investigator. Awarded $730,000. ** best proposal score in history of JAHVA
- Development of Motorcycle Helmets to Protect Against Traumatic Brain Injury. CDC / NCIPC. Role: Principal Investigator. $225,000. Submitted April 2015. Not funded
Book Chapters
- Lloyd JD and Haslam RA, “Traumatogens Associated with Carpal Tunnel Syndrome.” In Harbison, R. (ed.) Industrial Toxicology Handbook, 5th edition. Mosby Publishers, St. Louis 1998
- Lloyd JD, “Biodynamics of back injury: Manual lifting and loads.” In Charney, C and Hudson A (eds.). Back Injury Among Healthcare Workers: Causes, Solutions and Impacts. CRC Press 2003
- Lloyd JD, “Patient Handling Technologies.” In Nelson, A. (ed.). Handle with Care: A Practice Guide for Safe Patient Handling and Movement. Springer Publishing Company 2006
- Lloyd JD and Baptiste A, “Patient Handling Technologies.” In: Charney, W (ed.). Handbook of Modern Hospital Safety, second edition. Taylor and Francis 2009
- Pappas IP, Del Rossi, G, Lloyd J, Gutmann J, Sackellares CJ et al. Synchronization and network measures in a concussion EEG paradigm. In Models, Algorithms and Technologies for Network Analysis. 2014.
- Lee WA and Lloyd JD “Biomechanical, Epidemiologic and Forensic Considerations of Pediatric Head Injuries” In Freeman MD and Zeegers M (eds). Forensic Epidemiology: Principles and Practice. Elsevier publishers, Oxford UK. 2016.
Scientific and Medical Journal Articles (Peer Reviewed)
- Nelson A, Gross C and Lloyd JD, (1997) Preventing musculoskeletal injuries in nurses: directions for future research. SCI Nursing 14(2): 45–51
- Gross C, Lloyd JD, Nelson A and Haslam RA, (1998) Carpal tunnel syndrome: A review of the literature with recommendations for further research. Florida Journal of Public Health 9(1): 22–28
- Lloyd JD and Kelleher, V, (2000). Patient safety center of inquiry plans effective dissemination of its findings throughout the VA. Veterans Health System Journal Aug 55–56.
- Nyland J, Quigley P, Huang C, Lloyd JD, Harrow J and Nelson A, (2000) Preserving transfer independence among individuals with spinal cord injury. Spinal Cord 2000 38(11): 649–657
- Nelson A, Tiesman T and Lloyd JD (2000) Get a handle on safe patient transfer and activity. Journal of Nursing Management 31(12): 47
- Baptiste A, Tiesman H, Nelson A and Lloyd JD (2002) Technology to Reduce Nurses’ Back Injuries. Rehabilitation Nursing 27(2), 43-44, 58.
- Smith LC, Weinel D, Doloresco L and Lloyd JD (2002) A clinical evaluation of ceiling lifts: lifting and transfer technology for the future. SCI Nursing 19(2): 75–7
- Nelson A, Owen B, Lloyd JD, Fragala G, Matz M, Amato M, Bowers J, Moss-Cureton S, Ramsey G and Lentz K, (2003) Safe Patient Handling and Movement: Preventing back injury among nurses requires careful selection of the safest equipment and techniques. American Journal of Nursing 103(3): 32–43
- Haiduven D, Baptiste A, Luther S, Lloyd JD, Wilkinson S and Bidot P. (2003) Development of a seated device for measuring diurnal variability in stature compression. Journal of Musculoskeletal Research 7(1): 49–60
- Nelson A, Lloyd JD, Gross C and Menzel N. (2003). Preventing Nursing Back Injuries – Redesigning Patient Handling Tasks. AAOHN Journal 51(3): 126–134
- Lloyd JD and Baptiste A. (2006). Friction reducing devices for lateral patient transfers: a biomechanical evaluation. American Association of Occupation Health Nursing (AAOHN). 54(3): 113–119
- Baptiste A, Boda SV, Nelson AL, Lloyd JD and Lee W. (2006) Friction-reducing devices for lateral patient transfers: a clinical evaluation. American Association of Occupation Health Nursing (AAOHN) 54(4): 173–80
- Nelson A, Matz M, Chen F, Siddharthan K, Lloyd JD and Fragala G, (2006) Development and Evaluation of a Multifaceted Ergonomics Program To Prevent Injuries Associated with Patient Handling Tasks International Journal of Nursing Studies 43: 717–733
- Gironda RJ, Lloyd JD, Clark ME and Walker RL. (2007). Preliminary Evaluation of the Reliability and Criterion Validity of the Actiwatch-Score. Journal of Rehabilitation Research and Development 44 (2): 223–30
- Bowers B, Lloyd J, Lee W, Powell-Cope G and Baptiste A. (2008). Biomechanical evaluation of injury severity associated with patient falls from bed. Rehabilitation Nursing 2008 33(6): 253–9
- Schulz BW, Lee WE and Lloyd JD. (2009). Estimation, Simulation, and Experimentation of a Fall from Bed. Journal of Rehabilitation Research & Development 2009 45(8): 1227 — 1236
- Schulz BW, Lloyd JD and Lee WE, (2010). The Effects of Everyday Concurrent Tasks on Overground Minimum Toe Clearance and Gait Parameters. Gait and Posture May 2010 32(1): 18–22
- Waters TR, Short M, Lloyd, JD, Baptiste A, Butler L, Peterson C and Nelson A, (2011) AORN Ergonomic Tool 2: Positioning and Repositioning the Supine Patient on the OR Bed. AORN Journal 93(4): 445–449
- Hughes NL, Nelson A, Matz M and Lloyd J. (2011). AORN Ergonomic Tool 4: Solutions for Prolonged Standing in Perioperative Settings. AORN Journal 93(6): 767–774
- Spera S, Lloyd J, et al. (2011) AORN Ergonomic Tool 5: Tissue Retraction in the Perioperative Setting. AORN Journal 94(1): 54-8.
- Water T, Lloyd J, Hernandez E & Nelson A. (2011) Ergonomics Tool 7: Pushing, Pulling and Moving Equipment on Wheels. AORN Journal 94; (3): 254-260
- Lloyd et al. (2011) Biomechanical Evaluation of Infant Shaking compared with Pediatric Activities of Daily Living. Journal of Forensic Biomechanics
- Lloyd J. (2013) Biomechanical Evaluation of Head Kinematics During Infant Shaking Versus Pediatric Activities of Daily Living. Journal of Head Trauma Rehabilitation. SEP-OCT; 28; 5; pE60-pE60
- Lloyd J. (2013). Biomechanics of Brain Injuries Associated with Short Falls in Children. Journal of Head Trauma Rehabilitation. SEP-OCT; 28; 5; pE61-pE61
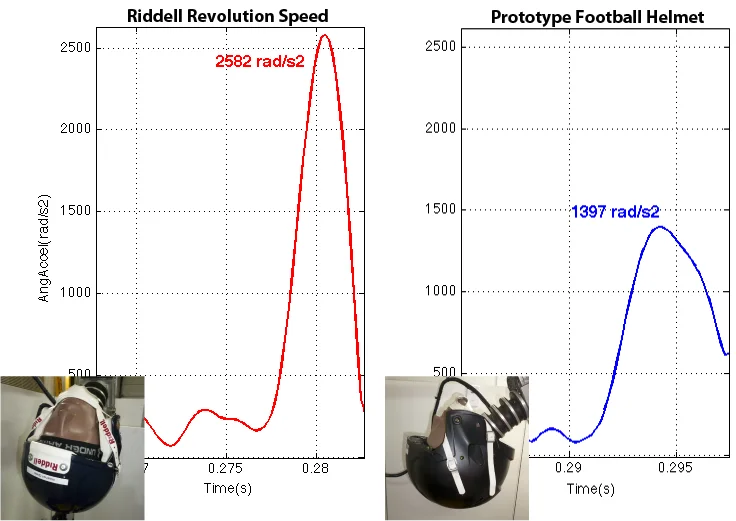
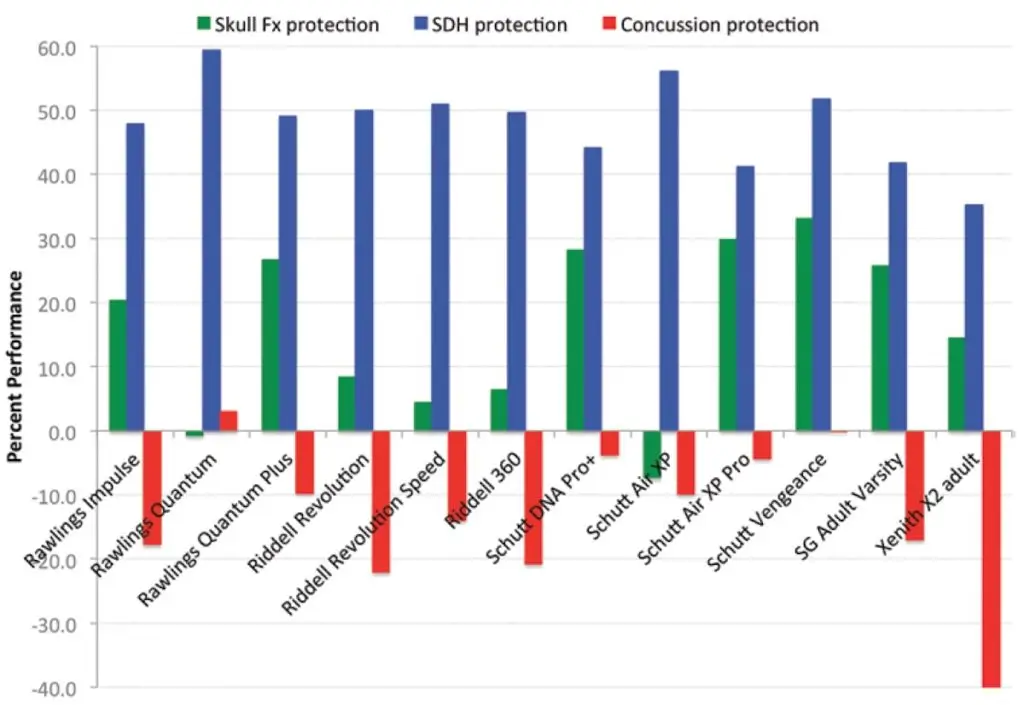
- Lloyd J. (2013). BRAINS Researchers Reveal Deficiencies in Football Helmet Design. Journal of Head Trauma Rehabilitation. SEP-OCT; 28; 5; pE55-pE55
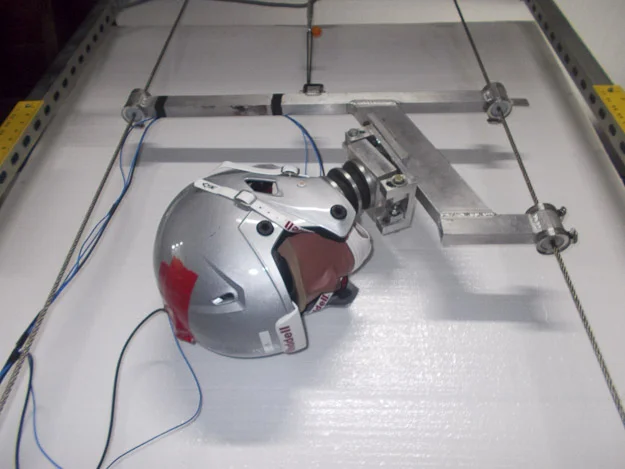
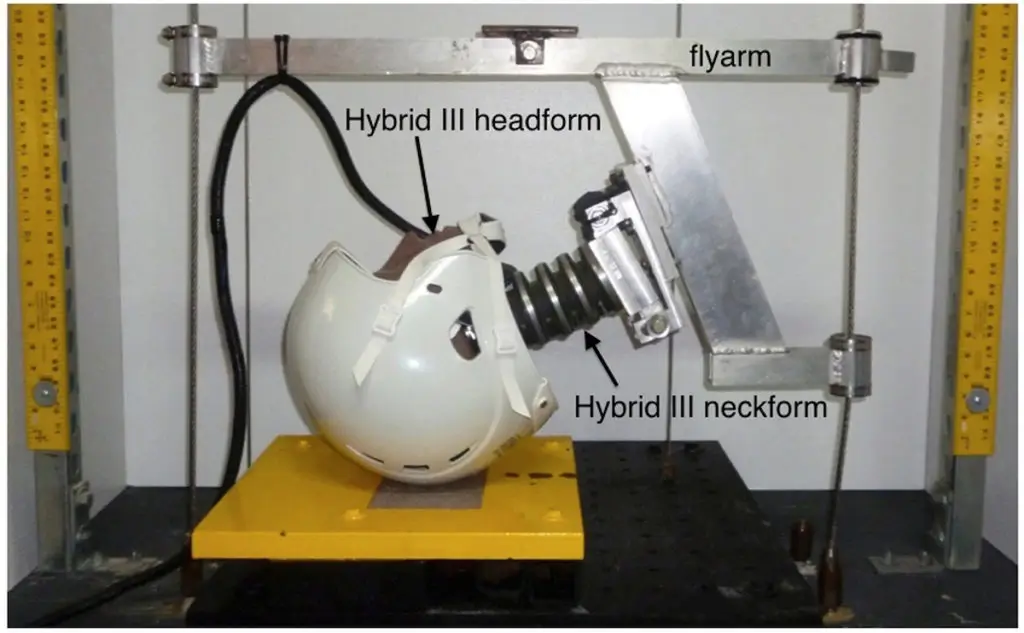
- Caccese V, Lloyd J, Ferguson J. (2014). An Impact Test Apparatus for Protective Head Wear Testing Using a Hybrid III Head-Neck Assembly. Experimental Techniques
- Lloyd J & Conidi F. (2015). Brain Injury in Sports. Journal of Neurosurgery. October.
- Lloyd J. (2016). Biomechanics of Solo Motorcycle Accidents. Journal of Forensic Biomechanics
- Sabbagh JJ, Fontaine SN, Shelton L, Zhang B, Hunt J, Lee DC, Lloyd J, Dickey CA. (2016). Non-contact accelerational head injury produces transient cognitive deficits and neuropathological changes. Journal of Neurotrauma
- Lloyd J. (2016). Biomechanics of Motorcycle Helmet Protection. Journal of Neurotrauma. Conference Abstract # PSB-199.
- Lloyd J. (2017). Biomechanical Evaluation of Motorcycle Helmets: Protection Against Head and Brain Injuries. Journal of Forensic Biomechanics.
- Barrett B, Phillips S, Lloyd J, Cowan L, Friedman Y et al. (2022) Evaluation of Protective Properties of Commercially Available Medical Helmets: Are Medical Helmets Protective? Journal of Patient Safety 18 (1).
- Lloyd J. (2022). Crash-Related Motorcycle Helmet Retention System Failures. Journal of Forensic Biomechanics 13:400.
- Lloyd J. (2024). Traumatic Brain Injuries in Helmeted Motorcycle Crashes. STAPP Journal / SAE (pending).
Journal Articles (Non-Peer Reviewed)
- Lloyd JD: (1995) Getting Injured Employees Back to the Workplace – Return to Work Planning. Workplace Ergonomics Magazine Steven Publishing, TX
- Lloyd JD: (1995) A Holistic Ergonomic Approach for Successful Return to Work. Chartered Property Casualty Underwriters Society, Malvern, PA
- Lloyd JD and Gross C: (1996) Ergonomic evaluation of pen design and writing characteristics. Ergonomics Intelligence Report James Publishing, Santa Ana, CA
- Lloyd JD and Gross C: (1996) Biomedical stress test for carpal tunnel syndrome. Ergonomics Intelligence Report James Publishing, Santa Ana, CA
- Lloyd JD: (1996) How to correctly set up an ergonomic office workstation. Ergonomics Intelligence Report James Publishing, Santa Ana, CA
- Lloyd JD: (1996) A checklist for the evaluation of ergonomic stress at computer workstations. Ergonomics Intelligence Report, James Publishing, Santa Ana, CA
- Gross C, Lloyd JD and Tabler R: Ergonomic Analysis of Pen Comfort and Wrist Dynamics While Writing. Unpublished. University of South Florida, Tampa, FL
- Gross C and Lloyd JD: (1997) HumanTRAC: A New Method for Rapid Product Ergonomic Assessments. Unpublished. University of South Florida, Tampa, FL
- Powell-Cope G, Moore H, Kearns W, Baptiste A, Lloyd JD, Applegarth S and Nelson A. (2005). The Case for Preventing Wandering and Associated Adverse Events for Veterans with Dementia. TIPS Nov/Dec 5(6): 3
- Investigating crashes 4 times faster with viDoc & PIX4Dmatic. Pix4D Industry Insights 1/29/2023.
- Motorcycle Rider and Conspicuity. BMW Motorcycle Owners of America Owner’s News. September 2024.
- Why I am Anal About My Tires. BMW Motorcycle Owners of America Owner’s News. October 2024.
- The Eyes of a Rider. BMW Motorcycle Owners of America Owner’s News. November 2024.
- Solo Motorcycle Crashes. BMW Motorcycle Owners of America Owner’s News. December 2024
Conference Proceedings
- Research Basis for the Development of a Dynamic Median Nerve Stress Test. Proceedings of American Occupational Health Conference. Orlando, FL, May 16, 1997
- ‘Work-related carpal tunnel syndrome’. Presented at Alabama Governor’s safety and health conference. Birmingham, AL. August 29, 2000
- Lloyd JD and Westhoff O. Development of an Intelligent Mannequin for Research in Safe Patient Handling and Movement. Proceedings of the Sixth Annual Safe Patient Handling and Movement Conference. Clearwater, FL, March 2, 2006
- Lloyd JD. Biomechanical Evaluation of Patient Transport Technologies – a project in development. Proceedings of the Sixth Annual Safe Patient Handling and Movement conference. Clearwater, FL, March 2, 2006
- Lloyd, JD. Developing Helmet Standards and Testing Methods to Protect from Brain Injury. Submitted to Proceedings of the ASTM Symposium on Concussion in Sports. Atlanta, GA. November 20, 2012
- Lloyd JD, Willey E & Lee W. Biomechanical Evaluation of Head Kinematics During Infant Shaking Versus Pediatric Activities of Daily Living. Proceedings of 67th American Academy of Forensic Sciences annual meeting, Orlando, FL. 2015.
- Lloyd JD & Lee WE. Biomechanical Evaluation of Inflicted Head Trauma. Proceedings of 67th American Academy of Forensic Sciences annual meeting, Orlando, FL. 2015.
- Lloyd JD. Biomechanics of Short Falls in Children. Proceedings of 67th American Academy of Forensic Sciences annual meeting, Orlando, FL. 2015.
- Lloyd JD. Biomechanical Evaluation of Shaken Impact Syndrome. Proceedings of 67th American Academy of Forensic Sciences annual meeting, Orlando, FL. 2015.
- Lloyd J. Biomechanics of Head and Brain Injury. Proceedings of 73rd American Academy of Forensic Sciences annual meeting. 2021.
Conference Abstracts
- Belsole RJ and Lloyd JD. Repetitive wrist movements: an adverse effect on median nerve conduction. American Society for Surgery of the Hand (ASSH). 54th Annual Meeting, 1998.
- Lloyd JD and Belsole RJ. Neurovascular considerations of median nerve neuropathy and implications for clinical diagnosis. American Society for Surgery of the Hand (ASSH). 54th Annual Meeting, 1998.
- Lloyd JD and Belsole RJ. Repetitive wrist movements: an adverse effect on median nerve conduction. University of South Florida Health Sciences Center Research Day, February 1999.
- Lloyd JD, Nelson AL, Gross CM and Menzel N. Redesigning Patient Handling Tasks and Equipment to Prevent Nursing Back Injuries. Department of Veterans Affairs, Health Services Research and Development. 19th annual meeting, February 2001.
- Lloyd JD. Repetitive Wrist Movements: Clinical Implications for Ergonomic Workplace Surveillance. International Society for Occupational Ergonomics and Safety annual meeting, June 2005.
- Lloyd JD. Clinical Biomechanics of Wheelchair Transfers and Repositioning Tasks in SCI. 20th Congress of the International Biomechanics Society and 29th Annual Meeting of the American Society of Biomechanics, August 2005.
- Lloyd JD and Harrow JJ. Clinical Biomechanics of Wheelchair Transfers in Spinal Cord Injury. American Paraplegic Society Annual meeting, September 2005.
- Harrow JJ and Lloyd JD. Biomechanical Assessment of Pressure-Relief and Repositioning Tasks in Persons with SCI. American Paraplegic Society annual meeting, September 2005.
- Lloyd JD and Harrow JJ. Clinical Biomechanics of Wheelchair Transfers in Spinal Cord Injury. American Association of SCI Nursing annual meeting, September 2005.
- Harrow JJ and Lloyd JD. Biomechanical Assessment of Pressure-Relief and Repositioning Tasks in Persons with SCI. American Association of SCI Nursing annual meeting, September 2005.
- Lloyd JD and Harrow JJ. Biomechanical Assessment of Independent Wheelchair Transfers in Persons with SCI. American Association of SCI Nursing annual meeting, September 2006.
- Campbell RR, Lloyd JD and Gutmann J. VHA Trends in the total costs of care for the polytrauma cohort: Disproportionate impact of post-acute inpatient care. Federal Interagency Conference on Traumatic Brain Injury, 2011
- Lloyd JD, Gutmann J and Arslan O. Toward Biomechanical Understanding of Brain Kinematics Associated with TBI using cadaveric specimens. Federal Interagency Conference on Traumatic Brain Injury, 2011
- Lloyd JD, Gutmann J and Del Rossi G. Do Ill-Fitting Helmets Amplify the Risk of Head Injury Among Youth Football Players? – A Biomechanical Analysis, with Discussion for Applicability to Military Protection. Federal Interagency Conference on Traumatic Brain Injury, 2011
- Lloyd JD, Gutmann J, Craighead J & Del Rossi G. Do Helmets Prevent Concussion? 8th Annual Conference of Blast TBI, December 2011, Tampa.
- Lloyd JD, Gutmann J, Craighead J & Arslan O. Biomechanics of Blast TBI. 8th Annual Conference of Blast TBI, December 2011, Tampa.
- Lloyd JD & Lee WE. Biomechanics of Inflicted Head Trauma. Presented at 4th Penn State Hershey International Conference on Pediatric Abusive Head Trauma, June 27-28, 2013, Burlington, VT.
- Lloyd J & Conidi F. How well do Football Helmets Protect Against Concussion and Traumatic Brain Injuries? Presented at 2014 annual meeting of the American Academy of Neurology.
- Sackellares JC, Lloyd J & Vega D EEG of Concussive Impact in Football. Submitted to American Academy of Sports Neurology Sports Concussion meeting, July 2014. Chicago.
- Lloyd J & Conidi F. Preventing Concussion in Sports – A Proposed Biomechanical Threshold. Submitted to American Academy of Sports Neurology Sports Concussion meeting, July 2014. Chicago.
- Lloyd JD. Military Helmets May Provide Little Protection Against Traumatic Brain Injury. Presented at Military Health System Research Symposium, August 2014. Fort Lauderdale.
- Lloyd JD, Willey E & Lee W. Biomechanical Evaluation of Head Kinematics During Infant Shaking Versus Pediatric Activities of Daily Living. Accepted for presentation at American Academy of Forensic Sciences 2015 annual meeting, Orlando, FL.
- Lloyd JD & Lee WE. Biomechanical Evaluation of Inflicted Head Trauma. Accepted for presentation at American Academy of Forensic Sciences 2015 annual meeting, Orlando, FL.
- Lloyd JD. Biomechanics of Short Falls in Children. Accepted for presentation at American Academy of Forensic Sciences 2015 annual meeting, Orlando, FL.
- Lloyd JD. Biomechanical Evaluation of Shaken Impact Syndrome. Accepted for presentation at American Academy of Forensic Sciences 2015 annual meeting, Orlando, FL.
- Lloyd JD & Conidi FX. Biomechanical Evaluation of Helmet Protection Against Concussion and TBI. Presented at International State-of-the-Science Meeting on the Biomedical Basis for Mild Traumatic Brain Injury (mTBI) Environmental Sensor Threshold Values. November 2014. MacLean, VA.
- Lloyd JD, Sabbagh J & Dickey C. Investigating the Effects of Mild Blast Injury on TBI Symptoms and Tau Pathology. Presented at International State-of-the-Science Meeting on the Biomedical Basis for Mild Traumatic Brain Injury (mTBI) Environmental Sensor Threshold Values. November 2014. MacLean, VA.
- Conidi FX and Lloyd JD. Incidence of Traumatic Brain Injury in retired NFL Players. Correlation with Diffusion Tensor MRI Imaging and Neuropsychological Testing. Annual meeting of the American Academy of Neurology. 2016.
- Lloyd J. Brain Injury in Sports. North American Brain Injury Society 13th Annual Conference on Brain Injury. 2016.
- Lloyd J. Biomechanics of Motorcycle Helmet Protection. National Neurotrauma Society. 2016.
- Lloyd J. Biomechanics of Head and Brain Injury. American Academy of Forensic Sciences. 2021.
Technical Reports
- Lloyd JD: Controls and displays. In: Whalley S et al: Ergonomic guidelines for the offshore oil and gas industry. R.M. Consultants Ltd., Warrington, England, 1989.
- Lloyd JD: Cumulative trauma disorders of the upper extremities – Experiment report: Liberty Mutual Insurance Co., Boston, MA, 1991.
- Lloyd JD: A human factors approach to the design and implementation of mobile data terminals in British Gas service engineer’s vehicles. Thesis – University of Technology, Loughborough, Leicestershire, England, 1992.
- Nair C and Lloyd JD: Ergonomic assessment of the N250 flight deck. PT. Industri Pesawat Terbang Nusantara, Indonesia, 1992.
- Rome D, Ratner D, Braveman K and Lloyd JD: Mannequin tutorial. In: Mannequin High – ergonomics in design. Biomechanics Corporation of America, Melville, NY, 1992.
- Lloyd JD: Ergonomic assessment of risk and liability for heavy electronics manufacturing facility. Square D Company, Smyrna, TN, 1992.
- Lloyd JD: AADCAS Phase II – a comprehensive anthropometry and reach study using sonic digitization techniques. Grumman Aircraft Systems, Grumman Corporation, Bethpage, NY, 1992.
- Lloyd JD: Ergonomic workplace assessment for materials handling operations. Fujitsu Network Transmission Systems Inc., Richardson, TX, 1993.
- Lloyd JD: Ergonomic assessment of risk and liability for a precision electronics assembly process. Fujitsu Network Transmission Systems Inc., Richardson, TX, 1993.
- Lloyd JD: Corporate ergonomics program for safety and environmental compliance. Biomechanics Corporation of America, Melville, NY, 1993.
- Lloyd JD: Ergonomic assessment of risk and liability, including NIOSH lifting evaluation. Philip Morris USA, Cabarrus Manufacturing Center, NC, 1993.
- Lloyd JD: Engineering Workplace Assessment. Sony Music, Carrolton, GA, 1993.
- Lloyd JD: Ergonomic assessment of risk and liability for aftermarket product manufacturing division. Allied Signal, Greenville, OH, 1993.
- Lloyd JD: Wrist Stress Determination. U.S. Surgical Corporation, CT, 1993.
- Lloyd JD: Ergonomic assessment of risk and liability for heavy assembly operation. Nevamar Corporation, Odenton, MD, 1993.
- Lloyd JD: Ergonomic assessment of risk and liability for a medical laboratory. MetPath Laboratories, PA, 1993.
- Lloyd JD: Ergonomic assessment of risk and liability for an office facility. Allied Signal, RI, 1993.
- Lloyd JD: Ergonomic assessment of risk and liability for packaging and warehouse activities. Allied Signal, Jackson Facility, TN, 1993.
- Lloyd JD: Ergonomic assessment of risk and liability for furnace operators. Climax Molybdenum Company, IA, 1993.
- Lloyd JD: Ergonomic assessment of risk and liability for unskilled manufacturing tasks. Climax Molybdenum Company, Langeloth Plant, PA, 1993.
- Lloyd JD: Ergonomic workplace assessment and cost benefit analysis for garment manufacturing facility. Bestop Inc. – Prepared for Ergonomics Solutions Group, 1993.
- Lloyd JD: Ergonomic assessment for an aftermarket product manufacturing facility. Allied Signal, UT, 1993.
- Lloyd JD: Ergonomic assessment of risk and liability for sorting and packaging workstations. Allied Signal, Aftermarket Filter Division, NV, 1993.
- Mitchell D, Nair C and Lloyd JD: Ergonomic assessment of risk and liability for a vehicle servicing facility. Salt River Project, Tempe, AZ, 1993.
- Lloyd JD: Ergonomic assessment of risk and liability for paper manufacturing activities. Armstrong World Industries, Lancaster, PA, 1993.
- Mitchell D, Costello K and Lloyd JD: Ergonomic assessment of risk and liability for gas construction and maintenance activities. Long Island Lighting Company, New York, NY, 1993.
- Lloyd JD: EARLY Workplace Assessment for The Prevention of Musculoskeletal Injuries. Neapco Inc., Pottstown, PA, 1993.
- Lloyd JD: Ergonomic Assessment of Risk and Liability for a Nursing Home. Presbyterian Manors, Topeka, KS, 1993.
- Lloyd JD: EARLY Workplace Assessment for The Prevention of Musculoskeletal Injuries – Electronic Sales Presentation. Pioneer Electronics, CA, 1993.
- Lloyd JD: EARLY Workplace Assessment for The Prevention of Musculoskeletal Injuries. American Honda Aftermarket Accessories Division, 1993.
- Lloyd JD: Ergonomic Analysis of ‘The Upper Hand’ as a Tool for Reducing Physical Stress Caused by Shoveling Activities. Brookhaven National Laboratories, 1994.
- Lloyd JD and Casar T: LILCO’s Ergonomics Initiative. Long Island Lighting Company, Gas Construction and Maintenance Division, New York, NY, 1994.
- Lloyd JD: Corporate Ergonomics Program for Safety and Environmental Compliance. Nu-Kanu, Inc., Long Island, NY, 1994.
- Lloyd JD: Training Manual for Ergonomics Laboratory. PT. Industri Pesawat Terbang Nusantara, Indonesia, 1994.
- Lloyd JD: Ergonomic Analysis to Identify Physical Stressors in the Workplace. Parker-Hannifin Corporation / Gull, Hauppauge, NY; 1994.
- Lloyd JD: Ergonomic Evaluation of a Hospital Emergency Reception Station with Recommendations for Redesign. John T. Mather Memorial Hospital, Port Jeff, NY; 1994.
- Lloyd JD: Introduction to Ergonomics. Northrop Grumman Corporation, Bethpage, NY; 1994.
- Lloyd JD: Mannequin v 1.1 Training Manual. Northrop Grumman Corporation, Bethpage, NY; 1994.
- Lloyd JD: Ergonomic Evaluation of Musculoskeletal Stress Associated with Abrasive Coating Process. IKG Industries / Harsco Steel Division, Nashville, TN; 1995.
- Lloyd JD: Anthropometry – Designing for an International Population. United Airlines, CA; 1995.
- Lloyd JD: Ergonomic Guidelines for Control Position and Configuration. United Airlines; 1995.
- Krueger GP, Lloyd JD and Casar T: Ergonomic and Biomechanic Best-In-Class Assessment of Five .22 Caliber Rimfire and One .223 Cal Center fire Rifles. c/o Biomechanics Corporation of America, Melville, NY; 1995
- Lloyd JD: Rapid Ergonomic Assessment of Cumulative Hazards. Batesville Casket Company, Manchester, TN; 1995
- Lloyd JD: Ph.D. Course in Human Factors Engineering. Kennedy-Western University; 1995
- Lloyd JD: M.S. Course in Ergonomics. Kennedy-Western University; 1995.
- Lloyd JD: Ergonomic Assessment of Occupational Risk Factors. Techalloy Company Welding Division, Baltimore, MD; 1995
- Lloyd JD: Rapid Ergonomic Assessment of Cumulative Hazards – Hardware Loader and Hardware Unloader. Batesville Casket Company, Manchester, TN; 1995.
- Gross C, Lloyd JD and Tabler R: Ergonomics Evaluation of Five Writing Instruments. Center for Product Ergonomics, University of South Florida; 1996
- Lloyd JD: Demonstration of R&D capabilities for ergonomic evaluation of Harley-Davidson motorcycles. Harley-Davidson Motor Company, Milwaukee, WI; 1996
- Patient Care Ergonomics Resource Guide: Safe Patient Handling and Movement. Patient Safety Center of Inquiry. October 2001
- CD-ROM Interactive Training Program on Safe Patient Handling and Movement. VA Employee Education Service. 2002
- Instrumented Mannequin for Restraint and Control Training: Final Report. VA Occupational Health, Washington, DC, January 2004
- AORN Guidance Statement: Safe Patient Handling and Movement in the Perioperative Setting. AORN (Association of periOperative Registered Nurses), Denver, CO; 2007
- Harrow JJ, Lloyd JD, Gironda R, Nelson A, Luther S, Schulz B, Applegarth S, Baptiste A and Cresta T. Final Report – Clinical Biomechanics of Wheelchair Transfers in Spinal Cord Injury: A Pilot Study. Report # B2900P. VA Rehabilitation Research and Development Service, Washington, DC; 2007
- Lloyd, JD. Tailored Medical Helmets for Specific Patient Populations and Co-Morbidities. Patient Safety Center of Inquiry, Tampa, FL; 2012
- Lloyd, JD. Biomechanical Evaluation of Safe Footwear for Institutional Patients, Considering Flooring Materials and Conditions. Patient Safety Center of Inquiry, Tampa, FL; 2012
- Ferguson J, Caccese V, Lloyd J. Development of Headwear to Prevent Fall-Related Injuries in Elderly Persons. NIH grant final report. 2014.
Podium Presentations
- ‘Ergonomics In Action’ seminar discussing the importance of workplace ergonomics. Institute of Industrial Engineers, Chapter 76. Long Island, NY, January 1994
- ‘Mannequin Man-Modeling and HumanCAD Training Workshop.’ Northrop Grumman Corporation. Bethpage NY, December 1994
- ‘Biomechanics Evaluation and Comparison of Two Pole Climbing.’ Long Island Lighting Company, Hicksville, NY, September 1995.
- ‘Introduction to the Center for Product Ergonomics’ NASA Occupational Health Group, Kennedy Space Center, FL; May 1996.
- ‘Ergonomics Applications in Space’ Bayonet Point Hospital, FL; July 1996.
- ‘Beyond Bricks and Mortar – Innovations for Senior Living: Ergo-House.’ West Central Florida Area Agency on Aging conference; September 17, 1996.
- ‘Ergonomics in Action!’ ITESM International Conference, Mexico City; September 24, 1996.
- ‘Applied Ergonomics in Flightdeck Design’ ITESM International Conference, Mexico City; September 25, 1996.
- ‘Ergonomics Applications in Space’ Department of Environmental and Occupational Health, University of South Florida; October 1996.
- ‘Research Basis for the Development of a Dynamic Median Nerve Stress Test’ American Occupational Health Conference, Orlando, FL; May 16, 1997.
- Grand Rounds: ‘Ergonomic applications for Spinal Cord Injury patients’ James A. Haley Veterans Hospital, Tampa, FL; May 23, 1997.
- ‘Product Ergonomics’ OSHA Regional Conference, Clearwater, FL; July 16, 1997.
- ‘Elderly falling study’. USF Institute on Aging Annual Meeting, Tampa, FL; April 24, 1998.
- ‘Etiology of musculoskeletal disorders’. Prevention of Musculoskeletal Injuries in Healthcare Workers: State of the Science. Tampa, FL; May 14, 1998.
- ‘Breakthrough research in injury prevention: What technology has to offer’. Prevention of Musculoskeletal Injuries in Healthcare Workers: State of the Science. Tampa, FL; May 15, 1998.
- ‘Ergonomic Risk Factors in the Workplace.’ Occupational Health and Safety Administration (OSHA), Tampa, FL; February 18, 1999.
- ‘Introduction to the 3D Static Strength Prediction Model’. National Aeronautical and Space Administration (NASA), Kennedy Space Center, FL; May 14, 1999.
- ‘How to Evaluate Ergonomic Products’. National Aeronautical and Space Administration (NASA), Kennedy Space Center, FL; May 14, 1999.
- ‘Repetitive wrist movements: an adverse effect on median nerve conduction’. American Society for Surgery of the Hand (ASSH). 54th Annual Meeting, Boston, MA; September 1999.
- ‘VA Biomechanics Research Laboratory – Virtual Tour’. James A. Haley Veteran’s Hospital, Patient Safety Center Press-Day. November 15, 1999.
- ‘Patient Safety Center of Inquiry – Technology Innovations Division’. US GAO. March 29, 2000.
- ‘Work-related carpal tunnel syndrome’. Alabama Governor’s safety and health conference. August 29, 2000.
- ‘Factors contributing to injuries related to patient handling’. VISN 8 PSCI Safe Patient Handling Conference. January 8-10, 2001.
- ‘Criteria for evaluating and selecting safe patient care equipment’. VISN 8 PSCI Safe Patient Handling conference, St. Petersburg Beach, FL; January 8-10, 2001.
- ‘Redesigning At Risk Tasks: A Panel Discussion., Safe Patient Handling and Movement conference. St. Petersburg Beach, FL; January 8-10, 2001.
- Satellite Broadcasts on Safe Patient Handling and Movement. A two part series (4 hours) held August 2001 and repeated in November 2001. Part I includes the Ergonomic Workplace Assessment Protocol for Patient Care Areas. Part II includes Selecting the Right Equipment, Patient Assessment Criteria, Algorithms, and Use of Back Injury Resource Nurses.
- ‘New and Emerging Technology for Safe Patient Handling and Movement’ VISN 8 PSCI Safe Patient Handling Conference, Clearwater, FL; January 16-18, 2002.
- ‘Biomechanics Research Laboratory: A Virtual Tour’ VISN 8 PSCI Safe Patient Handling Conference, Clearwater, FL; January 16-18, 2002.
- ‘Biomechanical Evaluation of Friction Reducing Devices.’ James A. Haley Veterans Hospital Research Day, Tampa, FL; April 25, 2002.
- ‘Evaluation of Technology to Support Safe Patient Handling and Movement.’ Safe Patient Handling and Movement Conference, Clearwater, FL; March 4-7, 2003.
- ‘Ergonomic Comparison of Overhead Ceiling Lifts and Mobile Floor Lifts’ VISN 8 PSCI Safe Patient Handling Conference, Clearwater, FL; March 4-7, 2003.
- ‘New Directions in Technology for Safe Patient Handling and Movement’ VISN 8 PSCI Safe Patient Handling Conference, Clearwater, FL; March 4-7, 2003.
- ‘Clinical Applications in Rehabilitation Engineering’ University of South Florida MS Rehabilitation Engineering program July 2, 2003.
- ’Injury Epidemiology and Prevention’ University of South Florida MPH Program. August 9, 2003.
- ‘Equipment Fairs and Clinical Trials: Obtaining Staff Buy-In’ Safe Patient Handling Conference, Orlando, FL; 2004.
- ‘Evaluation of Friction Reducing Devices for Patient Lateral Transfers in Critical Care’. Safe Patient Handling Conference, Orlando, FL; 2004.
- ‘Patient Risks Related to Trapeze Bar Repositioning’. Safe Patient Handling Conference, Orlando, FL; 2004.
- ‘Demonstration of a Mechanical Lateral Transfer Accessory to Patient Ceiling Lift Systems’. Safe Patient Handling Conference, Orlando, FL; 2004.
- ‘Equipment Fairs and Clinical Trials: Obtaining Staff Buy-In’ Safe Patient Handling Conference. Orlando, FL; 2004.
- ‘Equipment Fairs and Clinical Trials’ Safe Patient Handling Conference. Clearwater, FL; 2005.
- ‘Biomechanical Assessment of Pressure-Relief and Repositioning Tasks in Persons with SCI’ AASCIN Conference, Las Vegas, NV; September 2005.
- ‘Biomechanical Evaluation of Patient Transport Technologies’ Safe Patient Handling and Movement Conference. St. Petersburg, FL; 2006.
- ‘Development of an Intelligent Mannequin for Research in Safe Patient Handling and Movement’ Safe Patient Handling and Movement Conference. St. Petersburg, FL; 2006.
- ‘Biomechanical Evaluation of Injury Severity Associated with Patient Falls from Bed’ Evidence-Based Falls Prevention Conference. St. Petersburg, FL; 2006.
- ‘Biomechanical Assessment of Independent Wheelchair Transfers in SCI’ AASCIN Conference, Las Vegas, NV; September 2006.
- ‘Lateral Patient Transfer using a Friction Reducing Device’. November 2006.
- ‘Vertical Patient Transfer using a Ceiling-mounted Full-Body Lift System’. November 2006.
- ‘Bed to Chair Transfer using a Powered Stand-Assist Lift’. November 2006.
- ‘Vertical Patient Transfer using a Floor-Based Full-Body Sling Lift’. November 2006.
- ‘Coefficient of Friction: The Science of Slips, Trips and Falls’. Florida Justice Association. February 2007.
- ‘Safe Patient Handling in Operating Rooms’. Safe Patient Handling and Movement Conference. Orlando, FL; 2008.
- ‘Biomechanical Evaluation of Patient Transport Tasks’. Safe Patient Handling and Movement Conference. Orlando, FL; 2008.
- ‘Car Transfer Technologies’. Safe Patient Handling and Movement Conference. Orlando, FL; 2008.
- ‘Evaluation of Friction Reducing Devices’. Safe Patient Handling and Movement Conference. Orlando, FL; 2008.
- ‘Biomechanical Evaluation of Protective Technologies for Fall Injury Prevention’. Evidence-Based Falls Prevention Conference. Clearwater, FL; 2008.
- ‘Development of Evidence- Based Algorithms for Safe Patient Handling of Orthopedic Patients’. Invited paper presentation at the Sigma Theta Tau International Honor Society of Nursing, 19th International Nursing Research Congress, Singapore. 2008. (presented on behalf of project team by M. Doheny)
- Risks and solutions for safe patient handling in operating rooms. 9th Annual Safe Patient Handling and Movement Conference. Orlando. April 2009.
- ‘Transfer and Transport: Emerging technology and protocols for safe interdepartmental patient handling’. 9th Annual Safe Patient Handling and Movement Conference. Orlando. April 2009.
- ‘Helmet technology to minimize head injuries associated with falls’. 10th Annual Conference on Transforming Fall Management Prevention Practices. Clearwater, FL; May 2009.
- ‘Commercially available mats to prevent bed-related fall injuries’. 10th Annual Conference on Transforming Fall Management Prevention Practices. Clearwater, FL; May 2009.
- ‘Biomechanics of Traumatic Brain Injury’. Florida Public Defender’s ‘Life Over Death’ Annual Meeting. Naples, FL 2010
- ‘Technology Gaps Associated with Safe Patient Handling and Movement’. 11th Annual Safe Patient Handling and Movement Conference. Orlando. April 2011.
- ‘Biomechanics of Pediatric Brain Injury’. Department of Children and Families, Wildwood, FL. July 2012
- ‘Biomechanics of Pediatric Brain Injury’. Evidence Based Medicine and Social Investigation conference, Vancouver, Canada. August 3, 2012
- ‘Developing Helmet Standards and Testing Methods to Protect from Brain Injury’. Proceedings of the ASTM Symposium on Concussion in Sports. Atlanta, GA. November 20, 2012
- ‘Biomechanics of Pediatric Brain Injury’. Presented at Department of Office of the Public Defender, 13th Judicial Circuit, Tampa, FL. January 2013
- ‘Biomechanics of Inflicted Head Trauma’. Presented at 4th Penn State Hershey International Conference on Pediatric Abusive Head Trauma, June 27-28, 2013, Burlington, VT.
- Lloyd J. BRAINS Researchers Reveal Deficiencies in Football Helmet Design (0060) 11th Annual Conference on Brain Injury. September 18-21, 2013. New Orleans, LA.
- Lloyd J. Biomechanical Evaluation of Head Kinematics During Infant Shaking Versus Pediatric Activities of Daily Living. 11th Annual Conference on Brain Injury (0070). September 18-21, 2013. New Orleans, LA.
- Lloyd J. Biomechanics of Brain Injuries Associated with Short Falls in Children (0072). 11th Annual Conference on Brain Injury. September 18-21, 2013. New Orleans, LA.
- Lloyd J. Using LabVIEW to Design and Evaluate a Better Football Helmet. Tampabay LabVIEW users group meeting, May 21st, 2014. Tampa, FL.
- Lloyd J. Using LabVIEW and Compact DAQ for Brain Injury Research. NI week keynote presentation, August 5th, 2014. Austin, TX.
- Lloyd J. Using LabVIEW to Design and Evaluate a Better Football Helmet. NI week, August 7th, 2014. Austin, TX.
- Lloyd J. Mechanisms of Head and Brain Injury. Manasota Trial Lawyers Association meeting. August 27, 2014
- Lloyd JD, Willey E & Lee W. Biomechanical Evaluation of Head Kinematics During Infant Shaking Versus Pediatric Activities of Daily Living. American Academy of Forensic Sciences 2015 annual meeting, February 19th 2015. Orlando, FL.
- Lloyd JD & Lee WE. Biomechanical Evaluation of Inflicted Head Trauma. American Academy of Forensic Sciences 2015 annual meeting, February 19th 2015. Orlando, FL.
- Lloyd JD. Biomechanics of Short Falls in Children. American Academy of Forensic Sciences 2015 annual meeting, February 19th 2015. Orlando, FL.
- Lloyd JD. Biomechanical Evaluation of Shaken Impact Syndrome. American Academy of Forensic Sciences 2015 annual meeting, February 19th 2015. Orlando, FL.
- Lloyd JD. Biomechanics of Pediatric Head and Brain Trauma. Death is Different. February 20th, 2015. Orlando, FL.
- Lloyd J. Brain Injury in Sports. North American Brain Injury Society 13th Annual Conference on Brain Injury. April 8th, 2016. Tampa, FL
- Lloyd J. Biomechanical and Forensic Considerations of Pediatric Head Injury. Juvenile Law Dependency and Delinquency. Hosted by Florida Office of Criminal Conflict. Lake Mary, FL. June 8, 2017.
- Lloyd J. Accident Reconstruction and Human Risk Factors in Driver-Impaired Crashes. Hosted by Florida Bar Association, Masters of DUI seminar. Fort Lauderdale, FL. April 5, 2019.
- Lloyd J. Biomechanics of Head and Brain Injuries. American Academy of Forensic Sciences Virtual Annual Conference. February 18, 2021.
- Lloyd J. Distracted Driving: Causes and Consequences. IPTM Symposium on Traffic Safety. June 22, 2021.
- Lloyd J. Distracted Driving. WATAI Symposium on Human Factors. October 26, 2021.
- Lloyd J. Lead Vehicle Looming Crashes. WATAI Symposium on Human Factors. October 27, 2021.
- Lloyd J. Human Factors of Driving: Should We Be Allowed to Drive? WATAI Symposium on Human Factors. October 27, 2021.
- Lloyd J. Injury Biomechanics for the Accident Reconstructionist. WREX. April 19, 2023.
- Lloyd J & Forte M. Invesigating the How and Why of Motorcycle Accidents. FDLA. February 28, 2024.
- Lloyd J. Traumatic Brain Injuries in Helmeted Motorcycle Crashes. 68th STAPP Car Crash Conference, Columbus, OH. October 24, 2024.
Poster Presentations
- ‘Biomechanical assessment and stress test of dynamic postural sway to predict falls in healthy elderly’ Research Day, James A. Haley Veteran’s Hospital, Tampa, FL; April 15, 1998.
- ‘Effect of wrist exposures on median nerve conduction’ Research Day, James A. Haley Veteran’s Hospital, Tampa, FL; April 15, 1998.
- ‘A Flick of the Wrist’. University of South Florida President’s Council fundraising dinner. Tampa, FL; September 1998.
- ‘Repetitive wrist movements: an adverse effect on the median nerve’. University of South Florida Health Sciences Research Day. Tampa, FL; February 25, 1999.
- ‘Neurovascular considerations of median nerve neuropathy and implications for clinical diagnosis’. American Society for Surgery of the Hand (ASSH). 54th Annual Meeting, Boston, MA; September 1999.
- ‘Safe Patient Room of the Future.’ James A. Haley Veterans Hospital Research Day, Tampa, FL; April 25, 2002.
- ‘Stretcher Lift Design and Prototype.’ James A. Haley Veterans Hospital Research Day, Tampa, FL; April 25, 2002.
- ‘Whole-Body Biomechanical Model for Dynamic Analysis of Human Motion’ James A. Haley Veterans Hospital Research Day, Tampa, FL; April 29, 2005.
- ‘Biomechanical Evaluation of Patient Falls from Bed’. Evidenced-Based Strategies for Patient Falls and Wandering, Clearwater, FL; May 2005.
- ‘Estimation, Simulation, and Experimentation of a Fall from Bed’ 8th Annual Conference on Fall Prevention Strategies, Clearwater, FL; April 2007.
- ‘Estimation, Simulation, and Experimentation of a Fall from Bed’ James A. Haley Veterans Hospital Research Day, Tampa, FL; May 2007.
- ‘Evaluation of Fall Protection and Prevention Technologies’. 8th Annual Conference on Fall Prevention Strategies. Clearwater, FL; April 2007.
- ‘Estimation, Simulation, and Experimentation of a Fall from Bed’. 9th Annual Conference on Fall Prevention Strategies. Clearwater, FL; April 2007.
- ‘Biomechanical evaluation of the LiftSeat for independent patient toileting tasks’. 9th Annual Safe Patient Handling and Movement Conference. Orlando. April 2009.
- ‘The effects of everyday concurrent tasks on 3D overground minimum toe clearance and gait parameters’. 10th Annual Conference on Transforming Fall Management Prevention Practices. Clearwater, FL; May 2009.
- ‘Impact Testing to Evaluate Materials for Head Protection Devices’. 10th Annual Conference on Transforming Fall Management Prevention Practices. Clearwater, FL; May 2009.
- ‘Toward a Cadeveric Biomechanical Understanding of Brain Kinematics Associated with TBI’. JAHVA Research Day, 2011
- ‘VHA Trends in the total costs of care for the polytrauma cohort: Disproportionate impact of post-acute inpatient care’. Federal Interagency Conference on Traumatic Brain Injury, 2011
- ‘Toward Biomechanical Understanding of Brain Kinematics Associated with TBI using cadaveric specimens’. Federal Interagency Conference on Traumatic Brain Injury, 2011
- ‘Do Ill-Fitting Helmets Amplify the Risk of Head Injury Among Youth Football Players? – a Biomechanical Analysis, with Discussion for Applicability to Military Protection’. Federal Interagency Conference on Traumatic Brain Injury, 2011
- ‘Do Helmets Prevent Concussion?’ 8th Annual Conference of Blast Traumatic Brain Injury, December 2011, Tampa.
- ‘Biomechanics of Blast TBI’. 8th Annual Conference of Blast Traumatic Brain Injury, December 2011, Tampa.
- ‘Tampa VA Brains Researchers Reveal Deficiencies in Helmet Design’. Military Health Systems Review Symposium. August 2013, Fort Lauderdale, FL
- ‘How Well Do Football Helmets Protect Against Concussion and Brain Injury? American Academy of Neurology. April 30th, 2014. Philadelphia, PA.
- EEG of Concussive Impact in Football. American Academy of Sports Neurology Sports Concussion meeting, July 2014. Chicago.
- Military Helmets May Provide Little Protection Against Traumatic Brain Injury. Military Health Systems Research Symposium. August 2014. Ft. Lauderdale.
- Lloyd JD & Conidi FX. Biomechanical Evaluation of Helmet Protection Against Concussion and TBI. International State-of-the-Science Meeting on the Biomedical Basis for Mild Traumatic Brain Injury (mTBI) Environmental Sensor Threshold Values. November 2014. MacLean, VA.
- Lloyd JD, Sabbagh J & Dickey C. Investigating the Effects of Mild Blast Injury on TBI Symptoms and Tau Pathology. International State-of-the-Science Meeting on the Biomedical Basis for Mild Traumatic Brain Injury (mTBI) Environmental Sensor Threshold Values. November 2014. MacLean, VA.
- Lloyd JD & Conidi FX. Do Football Helmet Add-Ons Reduce Concussion Risk? American Academy of Neurology Annual Meeting. April 2015. Washington, DC
Conferences Attended
- West Central Florida Area Agency on Aging conference; September 17, 1996.
- ITESM International Conference, Mexico City; September 24, 1996.
- American Occupational Health Conference, Orlando, FL; May 16, 1997.
- OSHA Regional Conference, Clearwater, FL; July 16, 1997.James A. Haley Veterans Hospital Research Day, FL; April 15, 1998.
- Prevention of Musculoskeletal Injuries in Healthcare Workers: State of the Science. Tampa, FL; May 15, 1998
- University of South Florida Health Sciences Research Day. Tampa, FL; February 25, 1999.
- Alabama Governor’s safety and health conference. August 29, 2000.
- VISN 8 PSCI Safe Patient Handling Conference, St. Petersburg Beach, FL; January 8-10, 2001.
- VISN 8 PSCI Safe Patient Handling Conference, Clearwater, FL; January 16-18, 2002.
- James A. Haley Veterans Hospital Research Day, Tampa, FL; April 25, 2002.
- VISN 8 PSCI Safe Patient Handling Conference, Clearwater, FL; March 4-7, 2003.
- Safe Patient Handling Conference. Orlando, FL; 2004.
- James A. Haley Veterans Hospital Research Day, Tampa, FL; April 29, 2005.
- Safe Patient Handling Conference. Clearwater, FL; 2005.
- Evidenced-Based Strategies for Patient Falls and Wandering, Clearwater, FL; May 2005.
- AASCIN Conference, Las Vegas, NV; September 2005.
- Safe Patient Handling and Movement Conference. St. Petersburg, FL; 2006.
- Evidence-Based Falls Prevention Conference. St. Petersburg, FL; 2006.
- AASCIN Conference, Las Vegas, NV; September 2006.
- James A. Haley Veterans Hospital Research Day, Tampa, FL; May 2007.
- 8th Annual Conference on Fall Prevention Strategies. Clearwater, FL; April 2007.
- Florida Justice Association. February 2007.
- 8th Annual Safe Patient Handling and Movement Conference. Orlando, FL; 2008.
- 9th Annual Safe Patient Handling and Movement Conference. Orlando. April 2009.
- 10th Annual Conference on Transforming Fall Management Prevention Practices. Clearwater, FL; May 2009.
- Florida Public Defender’s ‘Life Over Death’ Annual Meeting. Naples, FL September 2010
- American Academy of Forensic Sciences meeting, Chicago, IL. February 2011.
- Introduction to the STAR Helmet Rating System. Virginia Tech, Blacksburg, VA. 2011.
- 11th Annual Safe Patient Handling and Movement Conference. Orlando. April 2011.
- James A. Haley Veterans Hospital Research Day, Tampa, FL; May 2011.
- Federal Interagency Conference on Traumatic Brain Injury, 2011
- 8th Annual Conference of Blast Traumatic Brain Injury, Tampa, December 2011
- James A. Haley Veterans Hospital Research Day, Tampa, FL; May 2012.
- Evidence Based Medicine and Social Investigation conference, Vancouver, Canada. August 3, 2012
- New Orleans, LA. October 13-17, 2012
- Special Operation Medical Association / Blast Traumatic Brain Injury, Tampa, December 2012.
- American Academy of Forensic Sciences, Washington, DC. February 2013.
- 4th Penn State Hershey International Conference on Pediatric Abusive Head Trauma, June 27-28, 2013, Burlington, VT.
- North American Brain Injury Society 11th Annual Conference on Brain Injury. September 18-21, 2013. New Orleans, LA.
- North American Brain Injury Society 26th Annual Conference on Legal Issues in Brain Injury. September 18-21, 2013. New Orleans, LA.
- American Academy of Neurology 66th annual meeting. April 28-May 2, 2014. Philadelphia, PA.
- American Academy of Sports Neurology Sports Concussion meeting, July 2014. Chicago.
- NI week. August 3-7, 2014. Austin, TX.
- Military Health Systems Research Symposium. August 2014. Fort Lauderdale, FL.
- International State-of-the-Science Meeting on the Biomedical Basis for Mild Traumatic Brain Injury (mTBI) Environmental Sensor Threshold Values. November 2014. MacLean, VA.
- Engineering Dynamic Corporation Accident Reconstruction Course. November 10-14. Miami, FL.
- American Academy of Forensic Sciences annual meeting. February 2015. Orlando, FL.
- Florida Association of Criminal Defense Lawyers. Death is Different XXI. February 2015. Orlando, FL.
- SAE International, April 2015. Detroit, MI.
- National SBIR conference. June 15-17. National Harbor, MD.
- ASTM International F08 meeting. November, 2015. Orlando, FL
- North American Brain Injury Society 13th Annual Conference on Brain Injury. April 7-9, 2016. Tampa, FL.
- World Reconstruction Exposition. May 2-6, 2016. Orlando, FL
- National Neurotrauma Annual Meeting. June 26-29, 2016. Lexington, KY.
- ASTM International F08 meeting. November 13-18, 2016. Orlando, FL
- American Academy of Forensic Sciences annual meeting. February 2017. New Orleans, LA.
- Juvenile Law Dependency and Delinquency. Hosted by Florida Office of Criminal Conflict. June 8-9, 2017. Lake Mary, FL.
- ARC-CSI Accident Reconstruction Conference. September 18-21. Las Vegas, NV.
- IPTM Symposium on Traffic Safety. May 21-24, 2018. Orlando, FL
- IPTM Symposium on Traffic Safety. June 3-6, 2019. Orlando, FL
- American Society of Biomechanics Virtual Annual Conference. August 3-7, 2020.
- American Academy of Forensic Sciences Virtual Annual Conference. February 15-19, 2021
- IPTM Symposium on Traffic Safety. June 21-24, 2021. Orlando, FL.
- Pix4D conference. October 12-13, 2022. Denver, CO.
- WREX 2023. World Reconstruction Exposition. April 17-21, 2023. Orlando, FL
- NHTSA Workshop on Human Subjects for Biomechanical Research, Columbus, OH. October 21, 2024
- STAPP Car Crash conference, Columbus, OH. October 22-24, 2024
Teaching Activities – – Graduate Students Supervised
- Robert Wilson, MS; USF Department of Electrical Engineering; 1998 – ‘Occupant trajectory determinant for vehicles equipped with airbag protection systems’
- Brian Waldron, BS; USF Department of Mechanical Engineering; 2000/1 ‘Engineering evaluation and modeling of harness design in full-body sling lifts’ – served as mentor for MS thesis
- Oneida Westhoff, MS; USF Department of Electrical Engineering; 2003 ‘Development of an Instrumented Mannequin for Safe Patient Handling and Movement’ – served as mentor and Professor on thesis committee
- Tony Cresta, MS; USF Department of Biomedical Engineering; 2003-6 ‘Biomechanical evaluation of independent transfers and pressure relief tasks in persons with SCI’ – served as mentor and Professor on thesis committee
- Sruthi Vasudev Boda, MS; USF Department of Biomedical Engineering; 2003 ‘Clinical evaluation of friction reducing devices for lateral transfer of patients’ – served as mentor and Professor on thesis committee
- Roberto Guerra, BS: USF Department of Electrical Engineering; 2004 ‘Development of an Instrumented Mannequin for Personal Safety Training’
- Tony Morreli, BS: USF Department of Electrical Engineering; 2004 – ‘Development of an Instrumented Mannequin for Personal Safety Training’
- Bonnie Bowers, MS; USF Department of Biomedical Engineering; 2004/5 ‘Biomechanics of Injuries Associated with Falls from Bed’ – served as mentor and co-Major Professor on thesis committee
- Fariba Vesali, MD; USF College of Medicine; 2004 ‘Biomechanical assessment of wheelchair transfers in persons with spinal cord injury’ – served as mentor for Medical residency program
- Maria Symeonidis; USF Department of Electrical Engineering; 2004 ‘Biomechanics of Injuries Associated with Falls from Bed’
- Jeffrey Harrow, PhD, MD; 2006 – served as mentor for Career Development Award
- Brian Schulz, PhD; 2007 – served as mentor for Career Development Award
- Shawn Applegarth, PhD (c); USF Department of Mechanical Engineering; 2006 – served as mentor for PhD dissertation in biomedical engineering
- Michael Kerrigan; USF Department of Biomedical Engineering; 2008 ‘Evaluation of advanced materials to protect against fall-related head injuries ‘ – served as mentor and Major Professor on thesis committee
- Lee Barks, PhD; 2008 – served as mentor for post-doctoral fellow
- Karen Mann; USF Department of Biomedical Engineering; 2009 ‘Evaluation of Transfer Technologies to Preserve Shoulder Function in SCI‘ – served as mentor and Professor on thesis committee
- Julie Kahn; USF Department of Biomedical Engineering; 2012-3. ‘Biomechanics of Patient Handling Slings Associated with Spinal Cord Injuries’ – served as mentor and Professor on thesis committee
- Karthick Nateson; USF Department of Biomedical Engineering; 2018-9. ‘Comparison of Laboratory and Field Data Acquisition Devices for Human Activity Recording’ – served as a mentor and Professor on thesis committee
- Jason Anderson; USF Department of Biomedical Engineering; 2020. ‘Psychology / Biomechanics of Falls Down Stairs’ – mentor and Co-Professor on thesis committee.
Intellectual Property
- Automotive Deceleration Indicator. Filed with USF Patents and Licensing office, 4/97.
- Automotive Audible Warning (Horn) Intensity Controller. Filed with USF Patents and Licensing office, 4/97.
- Determination of Occupant Trajectory in Airbag Protection Systems. Filed with USF Patents and Licensing office, 5/97.
- Airbag Deployment Directional Controller. Filed with USF Patents and Licensing office, 5/97. Patent application # WO2001044026A1 published 6/2001. Full patent not pursued.
- Airbag Depowerment Strategy as a Function of Impact Vector and Inertial Characteristics. Filed with USF Patents and Licensing office, 6/97.
- CPE USF Trademark / Service Mark / Certification Mark for display on ergonomically superior products. Filed with USF Patents and Licensing office, 7/97.
- Integrated vehicular security and personal assistance system. Filed with USF Patents and Licensing office, 10/97.
- Orthotic device to improve blood circulation in the median distribution of the hand. Filed with USF Patents and Licensing office, 3/98.
- Swimming pool feedback eyeball / diverter switch. Filed with USF Patents and Licensing office, 3/98.
- Method for biomechanical evaluation of joint kinematics. Filed with Department of Veteran’s Affairs patents and licensing office, 11/99.
- Integrated sling for patient lift manipulation. Filed with Department of Veteran’s Affairs patents and licensing office, 11/99.
- Technology improvement for air-assisted lateral transfer devices. Filed with Department of Veteran’s Affairs patents and licensing office, 7/02.
- Lateral Transfer Accessory. Patent awarded 10/3/06. # 7,114,203
- Limb Holding Device. Filed with Department of Veteran’s Affairs patents and licensing office, 09/06.
- Cerebral Stress Test for Objective Measurement of Brain Performance. Provisional Patent Application #61841612. 07/13. Full patent not pursued.
- Materials and their Application for Protection from Traumatic Brain Injury. Provisional Patent Application #61943488. 02/14. Full patent not pursued.
- Impact Absorbing Composite Material. Full US Patent Application. 05/14. Abandoned.
- Mathematical Method for Analysis of Helmet Protection Against Head and Brain Injury – filed with US Copyright Office 10/15. Abandoned.


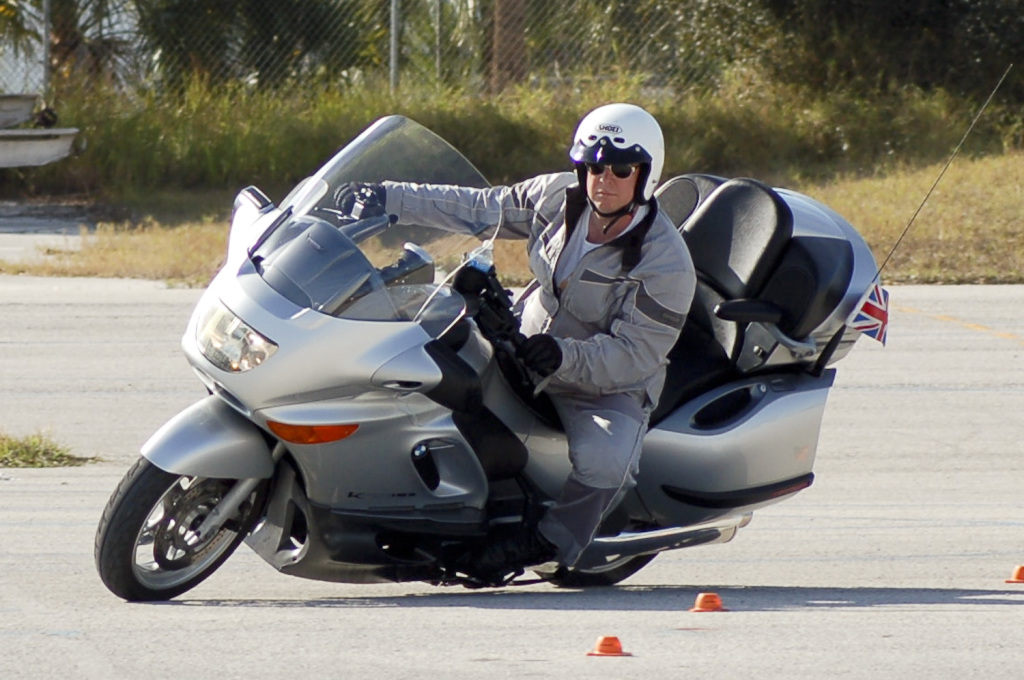 Dr. Lloyd has completed numerous advanced programs, including Motorcycle Safety Foundation (MSF), Experienced Rider Course and Total Rider Tech Advanced training.